Uncovering the Potential of Emerging Markets: Investment Opportunities and Risks

The metric worth opening any emerging market investment conversation with in 2026 is not the headline "emerging markets are back." It is MSCI EM's roughly 13 percentage points of outperformance over MSCI World through mid-November 2025, with China, Korea, and Taiwan accounting for about two-thirds of those returns. What that gap actually measures is realized 2025 return on a specific basket of stocks — concentrated mainly in three Asian economies and reweighted in 2025 toward the AI supply chain via Taiwan and Korea. What it does not tell you is whether the outperformance extends into 2026 (the Fed-cut path, dollar trajectory, and tariff regime all bear on this), and it does not tell you whether the right vehicle for retail exposure is the same basket that drove the 2025 numbers. The honest emerging-markets question for May 2026 is not "are EM going up" — that question reframes a sample to a forecast. The honest question is: which named ETFs, in which country mixes, at which allocation, match the regime we are actually in?
The rest of this article is the disciplined version. The 2026 macro setup that frames every EM allocation decision. The four major retail ETFs (VWO, EEM, IEMG, EMXC) compared on expense ratio, AUM, country weights, and recent return. The ex-China case with current numbers. India, Mexico, and Brazil as country-specific picks. EM bonds in a rate-cut cycle. The allocation framework — what percentage of a retail portfolio actually belongs in EM. And the risks, named with concrete examples rather than abstractions.
The 2026 EM Setup: Fed Cuts, Dollar Weakness, and Index Re-Weighting
Three macro factors anchor the May 2026 EM conversation:
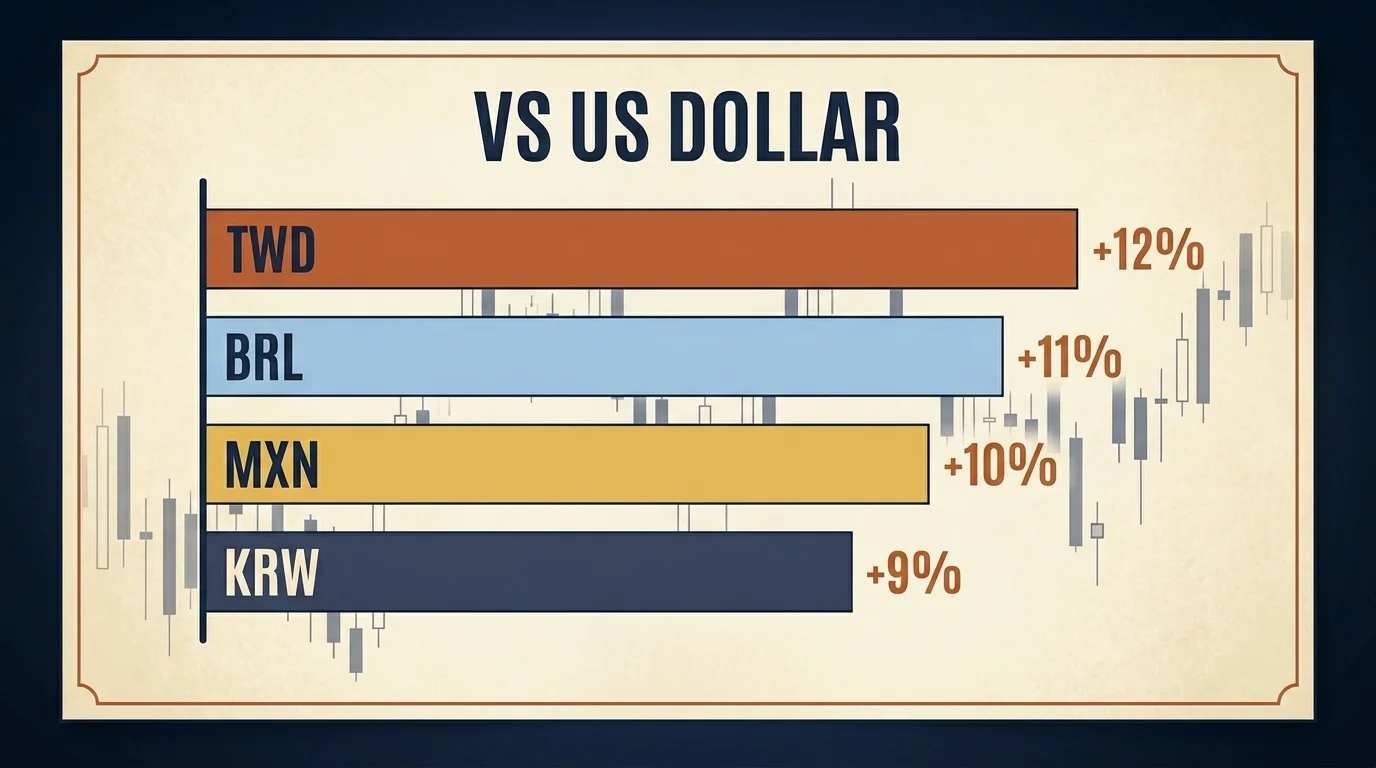
- Fed cuts and dollar weakness. The Fed is expected to cut three more times in 2026; the dollar weakened materially in 2025 against most EM currencies — BRL +11%, TWD +12%, MXN +10%, KRW +9%. Dollar weakness mechanically supports EM by reducing the external-debt burden of EM corporates and sovereigns and by lifting the dollar-translated value of local-currency assets.
- EM debt yields meaningfully above DM. Hard-currency EM debt yields about 6.8% in early 2026, down from 7.86% a year earlier — still well above developed-market sovereign yields, with local-currency debt the preferred 2026 wrapper.
- EM equities outperformed DM in 2025 for the first time since 2020. MSCI EM led MSCI World by 13 percentage points through mid-November 2025, driven primarily by China, Korea, and Taiwan.
What this setup does not tell you is whether any of these factors persist beyond the next twelve months. Fed cuts can be delayed by inflation surprises; dollar weakness can reverse if growth diverges; EM outperformance can mean-revert as it has done after every previous multi-year run. The disciplined response is to treat the current setup as a window in which EM exposure has a meaningfully favorable risk-reward, not as a permanent regime change.
MSCI EM in 2026: How the Index Was Rebuilt by the AI Rally
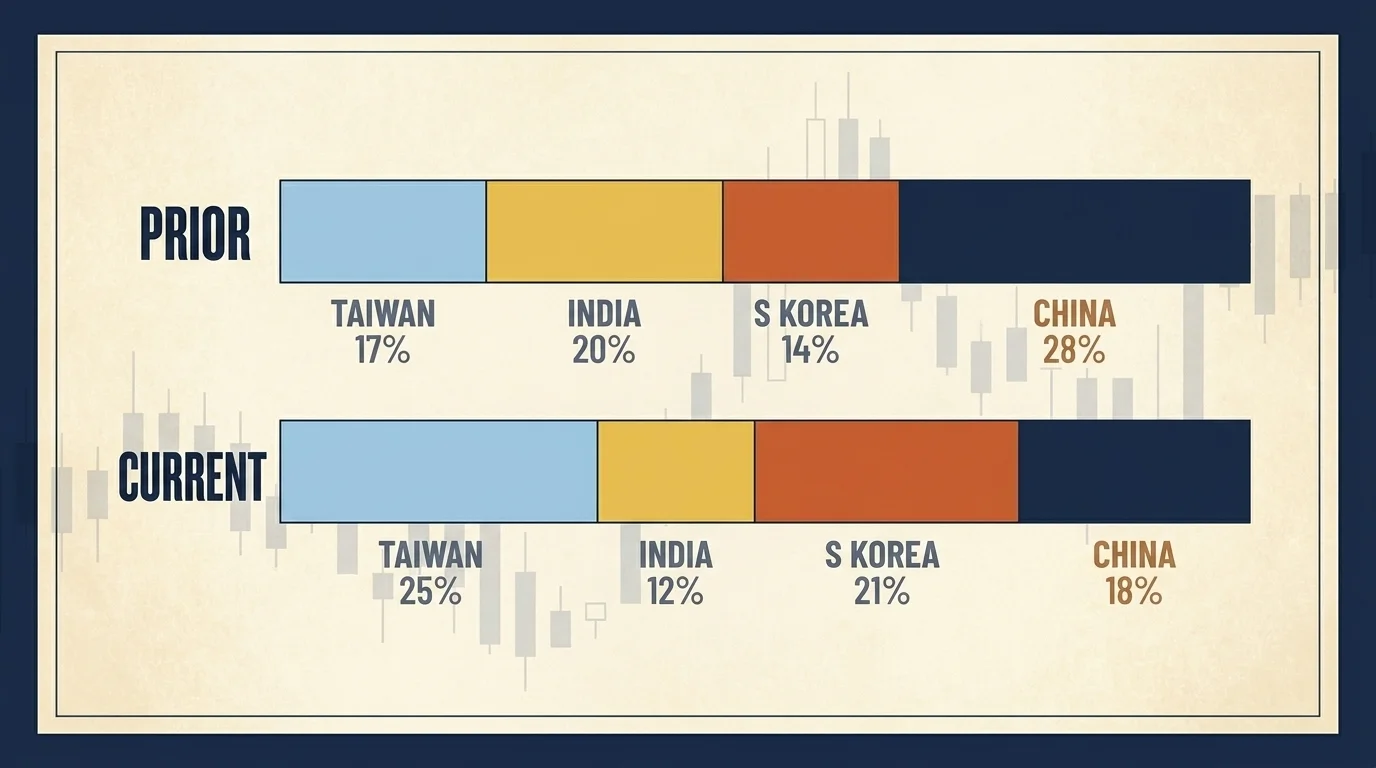
The single biggest structural change to the EM benchmark over the last 18 months is composition. The MSCI Emerging Markets Index, which most retail EM ETFs track, now has Taiwan as its top weight at approximately 24.84% — overtaking China — driven by a roughly 40% Taiex rally and TSMC's dominance in chip fabrication. India's weight in the index has collapsed from a 2024 peak of about 20% to roughly 11.94% in May 2026, the lowest in more than six years. South Korea sits at approximately 20.6%.
What this means for VWO and IEMG holders: the basket you bought in 2024 is materially different from the basket you hold in 2026, even if you never made a single trade. The index reweighted under you. Taiwan and Korea — together now roughly 45% of MSCI EM — are effectively an AI supply-chain bet at this point, owning TSMC, SK Hynix, Samsung, and the broader semiconductor ecosystem. China has been progressively reduced. India, despite being the strongest growth story in absolute terms, has been hit by ~$21 billion in foreign-institutional outflows and a >50 percentage point underperformance versus MSCI EM since 2024.
The disciplined response to this composition shift is one of three:
- Stay in the broad index and accept the reweighting as a feature, not a bug — the index is mechanically rotating into the names with the strongest realized fundamentals.
- Top up the underweight names by adding a single-country INDA or FLIN sleeve to bring your India exposure back to where you wanted it.
- Express the China-skeptic view explicitly by switching to EMXC (or pairing it with a broad EM fund).
There is a defensible case for all three, depending on your view on China and India. The wrong response is to assume the basket has not changed.
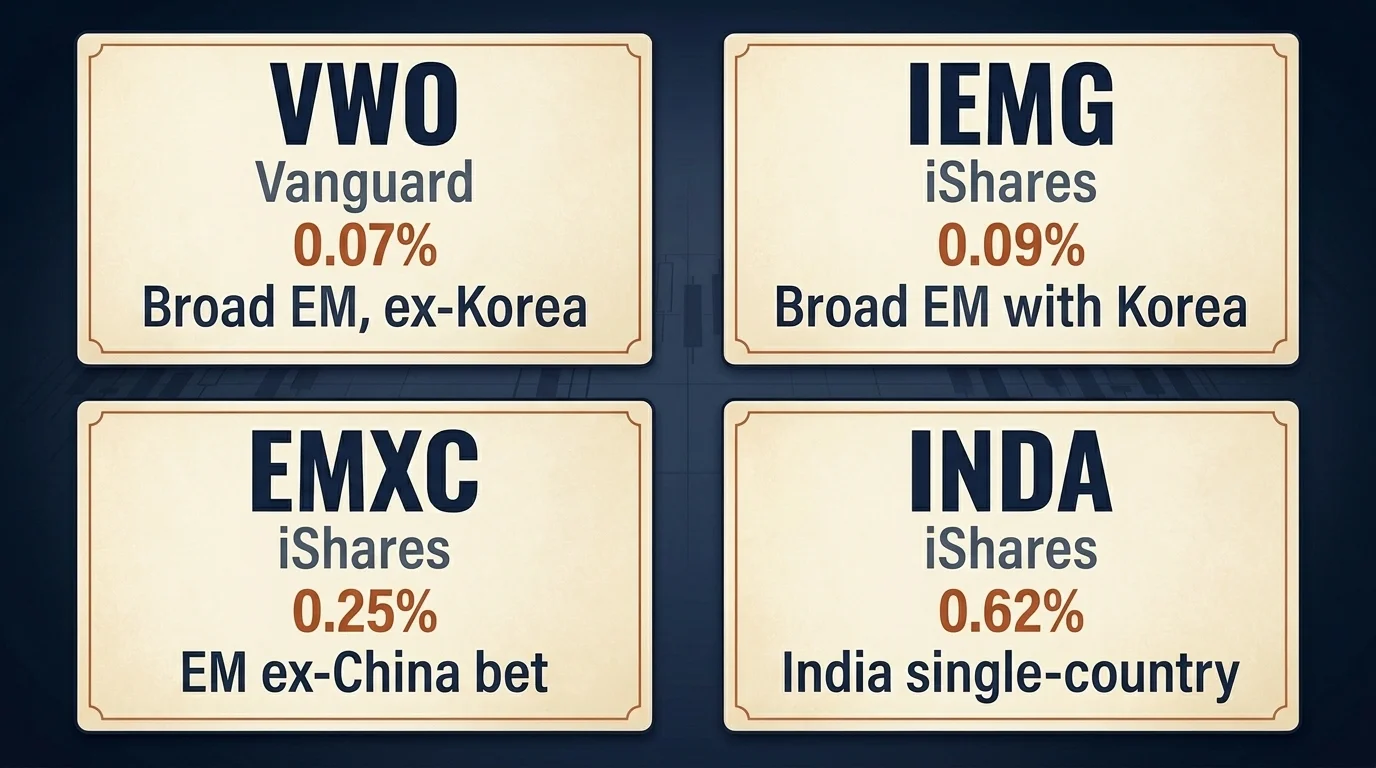
Best Emerging Markets ETFs for 2026: VWO, EEM, IEMG, EMXC
The four ETFs below cover most of the practical retail EM-exposure decision. The numbers are 2025–early 2026 published data; verify in each prospectus before allocating.
| Ticker | Issuer | Expense ratio | AUM | Holdings | South Korea? | 1Y return | Best for |
|---|---|---|---|---|---|---|---|
| VWO | Vanguard | 0.07% | ~$141B | ~6,146 | No (FTSE classifies as developed) | ~23.1% | Lowest-cost broad EM, widest holdings |
| EEM | iShares | 0.69% | ~$22B | ~1,200 | Yes (~11%) | Strong 2025 | Legacy iShares benchmark; less cost-efficient than IEMG |
| IEMG | iShares | 0.09% | ~$117B | ~2,725 | Yes (~10%) | ~29.2% | Broad EM with Korea exposure, low cost |
| EMXC | iShares | 0.25% | Growing rapidly ($4.82B six-month inflows) | ~700 | Yes | +45.9% (1Y to Jan 31, 2026) | Investors who want EM exposure without China policy risk |
The cleanest mental model: VWO and IEMG are the broad-EM workhorses; EMXC is the China-skeptic alternative; EEM is the legacy iShares fund that most analysts prefer to swap for IEMG on cost grounds.
VWO vs IEMG: Which Vanguard or iShares Workhorse?
The most-asked question in the EM ETF space, and the one that has the highest search-trend momentum (+88% YoY) of any head-to-head in the cluster. The answer in 2026:
- IEMG wins for broader exposure. IEMG includes South Korea (roughly 10% of fund), which VWO excludes because FTSE classifies Korea as developed. Korea's 2025 outperformance is the single biggest reason for the 6-point IEMG-versus-VWO return gap (29.2% vs 23.1% over the year ending December 19, 2025).
- VWO wins on cost and breadth. VWO's 0.07% expense ratio undercuts IEMG's 0.09%, and VWO holds roughly 6,146 stocks versus IEMG's 2,725 — meaningfully more depth in mid- and small-cap EM names.
- Both hold roughly 25%+ in Chinese equities. Neither solves China concentration if that is your concern; EMXC does.
The disciplined default for most retail allocators is IEMG, because the Korea inclusion captures the AI supply-chain exposure that has been driving recent EM returns. The disciplined alternative is VWO if you specifically want the broader holdings base and the lowest possible expense ratio. Both work. The wrong move is to switch between them quarter to quarter — pick one and hold it.
Why EMXC (Ex-China) Is the Fastest-Growing EM Strategy
EMXC — the iShares MSCI Emerging Markets ex-China ETF — is the highest-momentum sub-cluster in the EM keyword space, with search volume up roughly 238% year-over-year. The performance underneath the search interest is real: EMXC returned approximately 45.9% over the year ending January 31, 2026, with 2025 NAV return of 34.93% and roughly $4.82 billion in net inflows over the trailing six months. Morningstar rates it 4-star over 3-year and 5-year horizons.
What EMXC actually measures is straightforward — broad EM equity exposure without any China weight. The thesis underneath the flows is that China policy risk (regulatory crackdowns, US-China decoupling, tariff overhang) is structural rather than cyclical, and that a permanent allocation away from China captures most of the EM upside without the China-specific tail risk. The thesis has been validated in the 2024–2026 window but it is genuinely contestable: if China stages a sustained recovery from its current deep underweight, EMXC underperforms broad EM by definition.
The practical use cases for EMXC:
- As a satellite to VWO or IEMG — own a 70/30 blend of broad EM and EMXC to dial down China exposure without eliminating it.
- As the primary EM allocation for investors with strong China-skeptic views — sized at the full EM target weight, accepting that any China rally will hurt relative performance.
- For ESG mandates — investors with sustainability constraints that exclude state-owned-enterprise heavy regimes often find EMXC easier to defend than broad EM.
What this analysis does not tell you is which scenario plays out. The honest framing: EMXC is the highest-momentum EM strategy precisely because the China-skeptic view has been right for 18 months; the question is whether the trade is fully priced or still has room.
Country Picks: India, Mexico, Brazil
For investors willing to add country-specific sleeves on top of a broad EM core, three countries stand out for distinct reasons.
India: INDA vs FLIN, and Why the MSCI Drop Matters
India's MSCI EM weight has fallen from approximately 20% in 2024 to 11.94% in May 2026 — the lowest in more than six years. The reasons are mechanical (foreign-institutional outflows of approximately $21 billion) and price (India underperformed MSCI EM by more than 50 percentage points since 2024). The structural growth case for India — demographic dividend, services-led GDP, infrastructure spend, formal-economy share growing — has not changed. What changed is the relative valuation and the foreign-flow environment.
The practical implication: a VWO or IEMG buyer in 2024 owned approximately 20% India inside the broad EM fund; the same buyer in 2026 owns about 12%. If your target India exposure has not changed, the gap needs to be made up with a single-country sleeve.
Two clean retail vehicles:
- INDA (iShares MSCI India) — the default. Larger AUM, deeper liquidity, broader recognition.
- FLIN (Franklin FTSE India) — the value alternative. Lower expense ratio than INDA against very similar underlying exposure. Smaller AUM means somewhat lower liquidity but the cost saving compounds over multi-year holding periods.
For most retail allocators willing to add an India sleeve, FLIN is the marginal-cost-savings choice; INDA is the deepest-liquidity choice. The economic exposure is substantially the same.
Mexico: EWW and the Nearshoring Trade
Mexico is the standout nearshoring beneficiary of the ongoing trade-rewiring. The effective US tariff rate for USMCA-compliant Mexican exporters is approximately 2.3% versus a global average of about 10.1%. USMCA utilization climbed from roughly 45% to 89% between January and November 2025; Mexico attracted approximately $40.9 billion in foreign direct investment in the first three quarters of 2025 — up 14.5% year-over-year and already surpassing the full-year 2024 total. Wages in Mexico now run meaningfully below comparable Chinese benchmarks for many manufacturing categories.
The retail vehicle is EWW (iShares MSCI Mexico ETF). The case for it is the structural manufacturing migration plus the favorable US tariff treatment plus the BRL- and MXN-supportive Fed-cut cycle discussed above. The risk is policy: a renegotiation of USMCA or a re-escalation of tariff policy could compress the trade quickly.
Brazil: EWZ on Rate Cuts and Commodities
Brazil's EWZ ETF saw search interest up approximately 84% year-over-year on the back of two tailwinds: Brazilian central-bank rate cuts (BCB has more room to ease than most peers given its very high real rates) and commodity exposure (Brazil is heavily weighted to iron ore, oil, and agriculture, all of which benefit from continued Chinese commodity demand even amid the broader China-skeptic narrative). The currency carry has also been favorable — the BRL appreciated roughly 11% versus the dollar in 2025.
Brazil is the cyclical play in the country-pick sleeve; the disciplined sizing is small (3%–5% of the EM allocation) because the volatility is meaningful and the political risk is non-trivial.
Are Emerging Markets Bonds Worth Holding in 2026?
The fixed-income side of EM is structurally interesting in 2026 because of where rates sit. Hard-currency EM debt yields approximately 6.8% in early 2026 — down from 7.86% a year earlier but still well above most developed-market sovereign yields. State Street Global Advisors flags local-currency EM debt as the preferred wrapper for 2026, supported by the expected Fed cuts and dollar weakness.
The practical menu:
- EMB (iShares JPMorgan USD Emerging Markets Bond ETF) — hard-currency sovereign exposure; dollar-denominated, simpler tax treatment.
- VWOB (Vanguard Emerging Markets Government Bond ETF) — similar hard-currency exposure, lower expense ratio.
- EMLC (VanEck JPMorgan EM Local Currency Bond ETF) — local-currency exposure, captures both bond yield and EM-currency appreciation; higher volatility but the structural-tailwind play for 2026.
What this menu does not tell you is which sleeve fits your tax situation. EM bond income is fully taxable as ordinary income; local-currency funds compound currency volatility on top of bond duration risk. Both are appropriate for IRAs or 401(k)s; both carry meaningful tax friction in taxable brokerage accounts.
Specific sovereign opportunity stories that institutional managers are positioned around in 2026: Argentina's improving fiscal credibility under continued reform, Senegal's IMF support, and the eventual Ukraine reconstruction credit. None of these are accessible to retail investors as single-name exposures, but they show up in the underlying holdings of EMB and EMLC.
How Much of Your Portfolio Should Be Emerging Markets?
The honest answer depends on your time horizon and your tolerance for relative-return underperformance during the periods when EM lags developed markets. The conventional frameworks:
| Allocation tier | Logic | Typical proponent |
|---|---|---|
| 0–3% | "Avoid; EM volatility outweighs the diversification benefit" | Conservative income-focused retail |
| 5–7% | Target-date fund defaults; matches the EM weight in MSCI ACWI roughly | Most US 401(k) and target-date plans |
| 10–15% | Three-fund tilt; Bogleheads convention; expresses a mild EM-overweight | Bogleheads / disciplined index investors |
| 20–30% | Market-cap weight in some calculations; Cambria/Faber-style global tilt | Cambria, JPMorgan multi-asset "preference for EM assets" |
What this table does not tell you is the right answer for your situation. The 2026 macro setup — Fed cuts, dollar weakness, MSCI EM outperformance — argues for the upper end of your personal range, not for a permanent restructuring of the portfolio. A move from 7% to 12% EM is meaningfully different from a move from 7% to 25%, and the latter requires sustained conviction that the regime has structurally changed.
The disciplined sizing rules I would suggest:
- Set the target as a percentage of your equity sleeve, not your total portfolio. "10% of equity" is more durable than "10% of total" when the equity-bond mix itself shifts.
- Rebalance back to target rather than chasing the recent winner. If EM rallies 30% while DM goes flat, your EM weight rises mechanically; the discipline is to trim back, not let it ride.
- Pick one broad-EM vehicle and stick with it. Switching between VWO, IEMG, and EMXC quarter to quarter generates transaction costs without meaningfully improving exposure.
EM Risks in 2026: Tariffs, FX, ADR Delisting
The risk section in most EM articles uses words like "geopolitical risk" and "currency risk" without ever quantifying them. The concrete versions worth holding in mind:
Tariff and trade risk. On February 20, 2026, the US Supreme Court ruled 6-3 that the International Emergency Economic Powers Act (IEEPA) does not authorize tariffs, leaving only Section 232 tariffs in place. The ruling unwinds part of the Trump administration's tariff structure but leaves the underlying tariff regime substantially intact for national-security-justified imports. The practical implication is that the China-specific tariff overhang persists in a modified form, that USMCA-protected Mexico has a structural advantage that has now been court-validated, and that broad EM allocation does not need to bet on the tariff trajectory because the index has already adjusted to it.
Currency risk. EM currencies can move sharply in either direction. The 2025 BRL appreciation of 11% was supportive for US holders of EWZ; the equivalent peso-versus-dollar move in 2014–2015 — a multi-quarter 20%+ depreciation — wiped out years of equity gains for unhedged US holders. The volatility is asymmetric: in good periods, the currency adds to the equity return; in stress periods, it amplifies the equity loss.
ADR delisting and frozen-market risk. The clearest case study is Russia in 2022. When sanctions hit, MSCI removed Russian equities from the EM index at near-zero values, the RSX ETF was eventually liquidated, and US holders of Russian ADRs faced extended periods when their holdings simply could not be traded. The same structural risk applies to any EM where sudden sanctions or capital-control regimes could be imposed. For China specifically, the VIE structure of US-listed Chinese ADRs (Alibaba, JD.com, Tencent music) carries an additional layer of complexity that has periodically been threatened by regulatory action.
Concentration risk inside the index. As discussed in the MSCI re-composition section, the broad EM benchmark is now meaningfully concentrated in Taiwan + Korea + the AI supply chain. A semiconductor-cycle downturn would hit MSCI EM harder than the diversification of a 24-country index might suggest.
The risk profile of EM exposure has not gotten worse in 2026 — in some ways it has improved (Russia worked through its index removal, China is at structurally lower weight than two years ago, USMCA's tariff treatment is court-validated). What has changed is that the risks are now better named and more directly tradeable through specific ETF choices.
Related Article: Sustainable Investing: Aligning Values with Financial Goals
What Would Change My View
The thesis underneath this article is that EM equity exposure has a meaningfully favorable risk-reward in the May 2026 setup — Fed cuts, dollar weakness, MSCI EM led DM by 13 points in 2025, EMXC up 45.9% on a trailing-year basis — and that a sensibly sized EM allocation (10%–15% of the equity sleeve for most retail allocators, split between a broad-EM core and a small set of country sleeves) is the disciplined position.
What would change my view? Two things, specifically. First: if the dollar reverses materially against EM currencies for two consecutive quarters (DXY rising back above its mid-2024 high while BRL, TWD, MXN, KRW give back their 2025 gains). The Fed-cut and dollar-weakness story is the load-bearing macro pillar; without it, EM equity outperformance becomes much harder to sustain. Second: if Taiwan's AI-supply-chain rally compresses. The MSCI EM index is now structurally concentrated in semiconductor-cycle exposure via Taiwan and Korea — a serious semiconductor downcycle would hit the broad EM benchmark harder than its 24-country composition might suggest. I am watching three specific signals: the DXY index against a basket of EM currencies, TSMC's monthly revenue prints, and the Fed's stated dot-plot path. That combination, not any single number, would tell me the regime has changed.
Until that data shifts, the framework above looks like the right answer for the macro setup we actually have. The broad EM core, a small India sleeve to fill the MSCI weight gap, an optional EMXC overlay for China-skeptic positioning, and a small EM-debt position to capture the yield differential — all sized inside a 10%–15% allocation to a normal equity portfolio.
This article is for educational purposes only and is not individual financial advice. Emerging-market fund holdings, expense ratios, country weightings, and macro conditions change frequently — always verify each ETF's current prospectus and the relevant index methodology before allocating capital. Emerging-market investments carry currency, political, regulatory, and liquidity risks that can materially exceed those of developed-market investments. Consult a licensed financial advisor for guidance matched to your specific situation and read each fund's prospectus before investing. Past performance is not a guarantee of future returns.
Frequently Asked Questions
For broad, low-cost exposure, VWO (Vanguard, 0.07% expense ratio, 6,146 holdings, $141B AUM) and IEMG (iShares, 0.09%, ~2,725 holdings, $117B AUM) are the two pillars. IEMG returned 29.2% vs VWO's 23.1% over the year through Dec 19, 2025, largely because IEMG includes South Korea (~10% weight) while VWO classifies Korea as developed.
IEMG wins for broader exposure (includes South Korea, ~11% of MSCI EM). VWO wins on cost (0.07% vs 0.09%) and breadth of holdings (6,146 vs 2,725) with slightly lower beta. Both hold ~25%+ in Chinese equities, so neither solves China concentration. Pick one and hold it; switching between them quarter to quarter generates costs without improving exposure.
Performance suggests yes for 2025: EMXC returned 34.93% NAV in 2025 and 45.9% over the year ending Jan 31, 2026, with $4.82B in six-month inflows. It carries a Morningstar 4-star rating over 3Y and 5Y. EMXC makes sense if you want EM exposure without China policy and tariff risk; it underperforms if a China rally materializes.
Three Fed cuts are expected in 2026. Lower US rates weaken the dollar (BRL, TWD, MXN and KRW all rose 9-12% vs USD during 2025), which eases EM external debt burdens, lifts EM currencies, and historically supports EM equities. EM debt benefits directly: local-currency yields are the preferred 2026 wrapper.
There's no single answer, but common benchmarks are: target-date funds run ~5-7%, Bogleheads three-fund tilts typically allocate 10-15% of equity, and market-cap weighting (Cambria/Faber school) would imply 20-30%. JPMorgan currently maintains 'a preference for EM assets in our multi-asset portfolios' but does not publish a fixed %. Set the target as a percentage of your equity sleeve, not your total portfolio.
China is currently ~25%+ of VWO and IEMG, so passive holders own it whether they like it or not. EMXC (iShares MSCI EM ex-China) lets you opt out — the fastest-growing EM ETF strategy (+238% YoY search volume) and 45.9% 1Y return through Jan 31, 2026. The decision turns on whether you believe China's regulatory and tariff risk is structural (lean EMXC) or mean-reverting (lean VWO/IEMG).
INDA (iShares MSCI India) is the default — larger AUM, deeper liquidity, broader recognition. FLIN (Franklin FTSE India) is the value play: similar exposure at a lower expense ratio. Both matter more in 2026 because India's MSCI EM weight has fallen from ~20% in 2024 to ~11.94% in May 2026, meaning broad-EM ETF buyers now get materially less India unless they top up with a single-country sleeve.
Hard-currency EM debt yields ~6.8% in early 2026, down from 7.86% a year earlier but still well above developed-market sovereigns. Local-currency debt (VWOB, EMLC) is the preferred 2026 wrapper because of expected Fed cuts and dollar weakness. Specific high-yield sovereign opportunity stories include Argentina (improving fiscal credibility), Senegal (IMF support), and Ukraine (eventual reconstruction). Both wrappers are appropriate in IRAs; both carry meaningful tax friction in taxable accounts.
Mexico's effective US tariff rate is ~2.3% versus ~10.1% global average because USMCA-compliant goods largely escape new tariffs. USMCA utilization climbed from ~45% to ~89% between Jan and Nov 2025, and Mexico attracted $40.9B in FDI in the first three quarters of 2025 (+14.5% YoY). The Feb 20, 2026 SCOTUS ruling limiting IEEPA tariffs further protects the USMCA framework.
India's MSCI EM weight has dropped from a 2024 peak of ~20% to ~11.94% in May 2026 — the lowest in more than six years. The reason is a combination of $21B in FII outflows, India underperforming MSCI EM by more than 50 percentage points since 2024, and Taiwan's AI rally (TSMC-led) lifting Taiwan to ~24.84% as the new top weight. JPMorgan notes that India 'contributed little to returns' in 2025 because earnings growth was offset by multiple contraction.