The Art of Value Investing: Uncovering Undervalued Opportunities


The number worth opening with on value investing in 2026 is not a P/E ratio. It is the cash position on the balance sheet of the most-cited value investor of the last fifty years: Berkshire Hathaway closed September 2025 with approximately $381.6 billion in cash and short-term Treasuries, the largest cash pile in the company's history, accumulated across thirteen consecutive quarters of net stock sales. What that figure actually measures is what disciplined patience looks like in operational terms — three years of an investor with effectively unlimited buying authority finding very little worth buying at prevailing prices. What it does not tell us is when prices will fall to where Berkshire wants to deploy. That is, in any era, the open question of value investing.
Warren Buffett retired as Berkshire's CEO on December 31, 2025; Greg Abel took over January 1, 2026, with Buffett remaining as chairman. The succession is the largest narrative shift in value investing in a generation, and most of the value-investing content currently indexed by Google still treats Buffett as the active reference point. This guide does not. The principles outlive the practitioner, and the principles — buying below intrinsic value with a margin of safety, owning durable businesses, distinguishing real cash flow from accounting earnings, avoiding value traps — work in 2026 the same way they worked in 1949 when Graham first wrote them down.
This is a 2026 walkthrough of the practice: the metric that has displaced P/E among modern practitioners (free cash flow yield), the structural distinction most retail content collapses (quality value vs deep value), the universal SERP gap that costs investors more money than any other (value trap red flags), and the post-Buffett authority pillar (Howard Marks) that the field has quietly settled on. None of it is individual financial advice. All of it is starting material for the conversations a household should have with the licensed advisor who can translate the framework into a plan for their specific situation.
Why now: the 2026 value rotation
After multi-year Magnificent 7 dominance, the relative-performance gap between mega-cap growth and the rest of the market is closing. Magnificent 7 expected 2026 profit growth is approximately 18% versus approximately 13% for the S&P 493 — the narrowest spread since 2022. When growth premiums compress, capital tends to wander into segments where valuations are more defensible — banks, industrials, energy, healthcare. That is the 2026 setup as the data describes it.
The Russell 1000 Value Index returned 14.32% in 2024, a respectable absolute number that under-narrates because it sat in the shadow of the Mag 7 rally. The 2026 search-demand evidence makes the rotation visible elsewhere: "value investing strategy" is up 433% quarter-over-quarter and 85% year-over-year in U.S. search volume. Capital allocators and individual investors are simultaneously rotating attention. That is unusual.
This is not a forecast. The market may extend Mag 7 leadership for another two years; it may rotate aggressively into value next quarter. The honest framing is that the conditions favoring a value rotation — earnings-growth compression, valuation dispersion, regime-shift fatigue — are present in 2026 in a way they were not in 2021 or 2023. Whether that compresses into outperformance on any specific timeline remains, as always, the open question.
Essential principles of value investing
Three principles structure value investing across every serious practitioner from Graham forward.
Fundamental analysis
Fundamental analysis is the systematic evaluation of a business as a business — not as a ticker. The analytical work parallels what a private-equity investor would do before buying the entire company: understand the revenue model, evaluate the durability of the cash flow, assess the quality of management's capital allocation, identify the structural advantages (the economic moat) that protect the business from competition.
Morningstar's economic-moat framework names four moat types: network effects (Visa, Mastercard), switching costs (Microsoft Office, ERP systems), intangible assets (pharmaceutical patents, regulated franchises), and cost advantages (Walmart's scale, Costco's membership economics). A business without one of these is harder to value confidently because its long-run economics are vulnerable to competitive erosion.
The metrics value investors most commonly use:
- Free cash flow (FCF) — the cash a business produces after operating expenses and capital expenditures. Less manipulable than reported earnings.
- Return on invested capital (ROIC) — what the business earns on every dollar deployed. Sustainable ROIC above cost of capital is the mathematical signature of a moat.
- Price-to-earnings, price-to-book, EV/EBIT, EV/FCF — the valuation ratios that anchor any quantitative screen.
- Debt-to-equity and interest coverage — balance-sheet strength matters most when conditions tighten.
The fundamental-analysis discipline is what separates value investing from "buy stocks that look cheap." A stock that screens as cheap on P/E but has a deteriorating business is not a value opportunity. It is a value trap, and the section below covers how to tell the difference.
Margin of safety
Benjamin Graham's central insight was that valuation is approximate, not exact. No analyst — including the most disciplined — knows a business's intrinsic value to the second decimal. The margin-of-safety principle says: if your estimate of intrinsic value is approximately $X, only buy at materially less than $X. Graham's quantitative rule of thumb was to buy at no more than two-thirds of intrinsic value — leaving a 33% cushion against analytical error.
The Berkshire $381.6 billion cash position is the most concrete margin-of-safety lesson available to study. It is, in operational terms, the world's most prominent value investor refusing to deploy capital at prevailing prices for thirteen straight quarters. Greg Abel publicly committed in February 2026 to maintaining the cash position as strategic optionality, not deal-making retreat. What that says about discipline: patience is not a virtue. It is a measurable refusal to overpay.
Related Article: Finance Mentor vs Sponsor: What Actually Compounds a Career
Contrarian investing and behavioral biases
Value opportunities exist because markets misprice. Markets misprice because the participants making prices are humans subject to predictable behavioral biases. The four worth naming explicitly:
- Anchoring — investors anchor on prior prices and reference points. A stock that fell from $100 to $40 looks "cheap" against its prior price, regardless of whether $40 is below intrinsic value.
- Recency bias — recent results are weighted more heavily than long-run averages. A business with three good years gets richly priced; a business with three bad years gets cheaply priced — independent of whether those three years are representative.
- Herding — investors follow institutional flows and consensus narratives. When narratives collapse, herding produces forced selling that creates value opportunities.
- Confirmation bias — investors seek information that supports their existing thesis and discount information that contradicts it. Value investors actively look for the strongest argument against their own thesis before buying.
The contrarian framing is not "do whatever the crowd is not doing" — that is its own bias. The framing is: when sentiment swings hard in one direction, the marginal investor making prices is sentiment-driven, and pricing diverges from fundamentals. That divergence is what value investors are paid to identify.
Free cash flow yield: the metric of choice
P/E ratios are the metric most retail content leads with. Practitioners increasingly do not. The reason is mechanical: reported earnings can be massaged with accounting choices (depreciation methods, working-capital adjustments, one-time charges), while free cash flow is much harder to fake. Cash either showed up in the bank account or it did not.
Free cash flow yield = Free Cash Flow ÷ Enterprise Value (market capitalization + total debt − cash).
The interpretation bands most practitioners use:
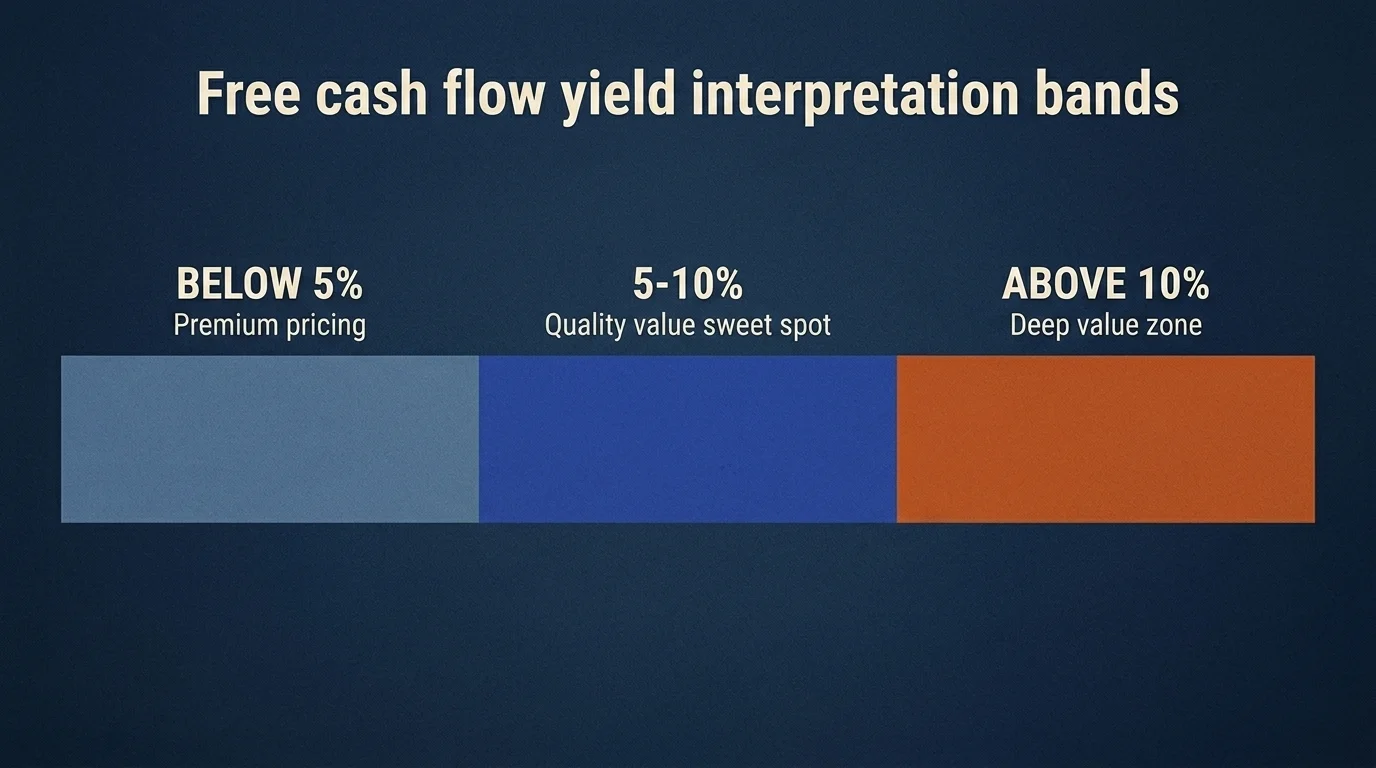
- Above 10%: deep-value territory. Either the business is genuinely under-priced, or there is something structurally wrong that the market has identified before you. Verify which.
- 5–10%: the quality-value sweet spot. Durable businesses with sustainable cash flows trade in this band. This is where Buffett-style compounders typically sit.
- Below 5%: premium pricing. The business may justify it (high-growth, exceptional ROIC, dominant moat), but you are paying for assumptions about future performance.
The 10-20x EV/FCF range — the inverse of 5-10% FCF yield — is the band research consistently identifies as the quality-value sweet spot for boring compounders and sustainable dividend payers. Below 10x EV/FCF (above 10% FCF yield), the market is signaling something — either a genuine bargain or a value trap. The two look identical on the screen and require different analytical work to distinguish.
A worked example: a hypothetical mid-cap industrial trades at $50 per share, has 100 million shares outstanding ($5 billion market cap), $1 billion of debt, $500 million of cash. Enterprise value = $5B + $1B − $0.5B = $5.5 billion. Free cash flow last twelve months = $400 million. FCF yield = $400M / $5,500M = 7.3%. That sits in the quality-value sweet spot, suggesting the business may merit further analytical work — provided the cash flow is durable, the moat is intact, and the balance sheet is sound.
Related Article: Youth-Led Financial Revolutions: Crowdsourcing as a Catalyst for Investment Innovation
Quality value vs deep value: two schools, one discipline
Most retail value-investing content collapses these two traditions into one. They are not the same.
Deep value, the Graham original, looks for statistical bargains: stocks trading below tangible book value, cyclicals at the bottom of their cycles, "net-nets" where market cap is below liquidation value of net working capital. The buy thesis is that the stock is mathematically too cheap given the assets behind it; outcome quality is secondary. Deep value works when the cycle turns or the assets get realized; it accepts business quality as a residual concern.
Quality value, the Buffett-Munger evolution, looks for durable businesses trading at modestly attractive prices. The buy thesis is that the business compounds cash flow over decades and the price is reasonable rather than exceptional. Outcome quality is the entire point. Quality value pays for moats; deep value waits for cycles.
Both work. Both fail in different conditions. Deep value generally outperforms in early-cycle recoveries when statistical bargains are abundant. Quality value generally outperforms across full cycles because durable cash flows compound through downturns that destroy lower-quality businesses.
The decision between them is mostly a temperament decision. Deep value requires patience for cycles that may not turn quickly and conviction in your liquidation analysis when management deteriorates. Quality value requires patience for compounding that is invisible in any single year and discipline not to overpay just because the business is excellent. Most retail value investors — and most professional value investors — drift toward quality value with a deep-value sleeve, because the quality-value framework is more forgiving of analytical error and more rewarding of durability.
How to find undervalued stocks: a 5-step process
Most retail content stops at "do fundamental analysis." Practitioners run a sequenced process. The version below is the discipline I would teach a new analyst on day one.
- Financial-statement review. Pull the most recent 10-K and three years of historicals. Verify revenue growth trajectory, gross/operating margin trends, working capital management, capital expenditure cadence, and balance sheet strength (debt-to-equity, interest coverage). Discard businesses with deteriorating fundamentals before doing any valuation work.
- Moat assessment. Identify the structural advantage. Network effects? Switching costs? Intangible assets (patents, regulatory franchises, brand)? Cost advantages? If you cannot articulate the moat in one sentence, the moat is probably not strong enough to value confidently.
- Free cash flow yield + intrinsic value calculation. Compute FCF yield. Then run a simplified DCF or a Graham formula calculation for an intrinsic value estimate. Cross-check the two. If they diverge meaningfully, understand why before proceeding.
- Margin-of-safety check. Compare the current price to your intrinsic value estimate. If the discount is less than 25-33%, pass. The margin of safety is what protects you from your own analytical error.
- Value-trap red-flag screen. Run the checklist below. If three or more red flags are present, the cheap valuation is signaling a problem rather than an opportunity.
The process compounds. Most stocks fail step 1 (deteriorating fundamentals). Some fail step 2 (no identifiable moat). Many fail step 4 (margin of safety insufficient). The few that pass all five steps are candidates for further work — not buys, candidates. The buy decision belongs to the investor with full knowledge of their portfolio context, risk tolerance, and time horizon.
Related Article: Red vs. Blue: The Battle of Colors in Investment Marketing
Value trap red flags
This is the section most retail value-investing content omits, which is unfortunate because value traps cost investors more money than any other class of mistake in this discipline. A value trap is a stock that looks cheap on metrics like P/E, P/B, or dividend yield but whose underlying business is in structural decline. Five red flags signal a trap:
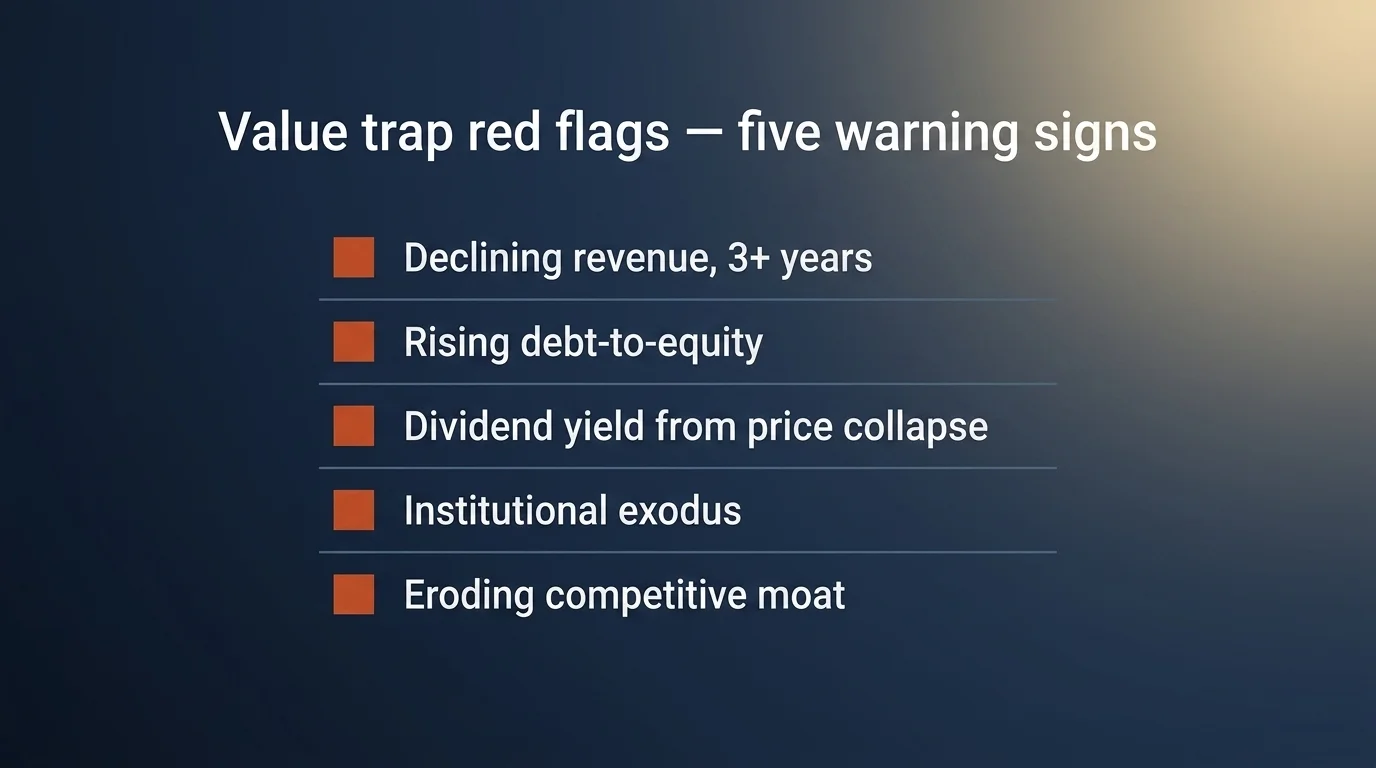
- Declining revenue across three or more consecutive years. A business with structurally declining revenue does not get cheaper by falling 30%; it gets less able to support its existing fixed costs.
- Rising debt-to-equity ratio. Cheap stocks with deteriorating balance sheets become uninvestable when conditions tighten and refinancing costs rise.
- Dividend yield jumping because the price collapsed, not because the dividend grew. A 10% dividend yield is rarely a gift. It is usually the market pricing in a dividend cut.
- Institutional investor exodus. Sustained quarterly declines in 13F holdings signal that informed buyers (hedge funds, mutual funds, pension allocators) are seeing what retail investors are not.
- Eroding competitive moat. Market share lost to better-positioned competitors is the single most important business-quality signal. A moat that is shrinking is a business whose long-run economics are decaying.
Two universally-cited examples make the pattern concrete. IBM (2012-2020) screened cheap on P/E and dividend yield throughout most of the decade as it lagged the cloud transition that AWS, Azure, and Google Cloud captured. The stock paid a 4-5% dividend while the underlying business shrank in revenue and operating cash flow. The cheap valuation was the market pricing in the structural cloud-transition lag. Sears under Eddie Lampert (2010-2018) was the textbook deep-value play that turned into a textbook value trap. The real estate appeared to provide a margin of safety; the retail business deteriorated faster than the real estate could be monetized. The stock went to zero.
The discipline is to verify a cheap stock is cheap because of mispricing, not because of a deteriorating business. The five-flag checklist above is the screen. Run it before any value purchase.
Build a value stock screen
Practitioner intent — "give me a reproducible screen I can run" — is the gap most retail content fails to fill. The following five filters approximate a quality-value screen that works on any standard tool (Finviz, Yahoo Finance Stock Screener, Stock Rover, Morningstar Premium):
- FCF Yield > 7% — quality-value sweet spot, with margin against P/E manipulation.
- Debt-to-Equity < 0.5 — balance sheet strength filter.
- Return on Invested Capital > 12% — moat signal, sustainable above cost of capital.
- Trailing P/E < 18 — valuation guardrail; not deep value, but not premium either.
- 5-Year Revenue CAGR > 0% — exclude businesses in revenue decline (the value-trap filter).
The screen output is candidates, not buys. Each candidate then runs through the five-step process above. A typical screen on the U.S. mid- and large-cap universe will return 40-80 names. Most fail at the moat-assessment or margin-of-safety stage. A handful — three to ten in any given quarter — warrant further analytical work.
A related practitioner approach: the Magic Formula, popularized by Joel Greenblatt in The Little Book That Beats the Market, ranks stocks on two criteria — earnings yield (EBIT/EV) and return on capital — and buys the top combined-rank names equally weighted. The AAII implementation returned +11.3% YTD through September 30, 2025, against +4.2% for the S&P SmallCap 600 and +5.8% for the S&P MidCap 400 — its best relative year since 2022. The Magic Formula is not magic; it is a quantitative implementation of the quality-value framework. Mechanical screens of this kind work in periods when human attention drifts elsewhere; they underperform in periods when sentiment drives prices. 2026 looks like the former.
The post-Buffett era and Howard Marks
The succession at Berkshire on December 31, 2025 is the most consequential value-investing event in a generation. Greg Abel publicly committed to retaining the cash position and the disciplined capital-allocation framework. Whether Abel's tenure produces the same long-term returns as Buffett's is a question only the next decade answers; the framework is unchanged.
What has shifted is the citation landscape. With Buffett retired, the most-quoted living value practitioner is Howard Marks, co-founder of Oaktree Capital. Marks's quarterly memos, published since 1990, are the canonical modern source on cycle dynamics, risk attitudes, and the mismatch between security prices and intrinsic values. His August 2025 memo "The Calculus of Value" revisited the relationship between price and value with the kind of clarity that made Graham's Mr. Market parable famous: security prices fluctuate far more than intrinsic value because investor sentiment is more volatile than business fundamentals. The memos are publicly available on Oaktree's site and are required reading for any serious value investor.
The shift from Buffett to Abel-plus-Marks is a generational transition, not a regime change. The principles are identical. The voices articulating them are different.
Value vs growth: a comparison
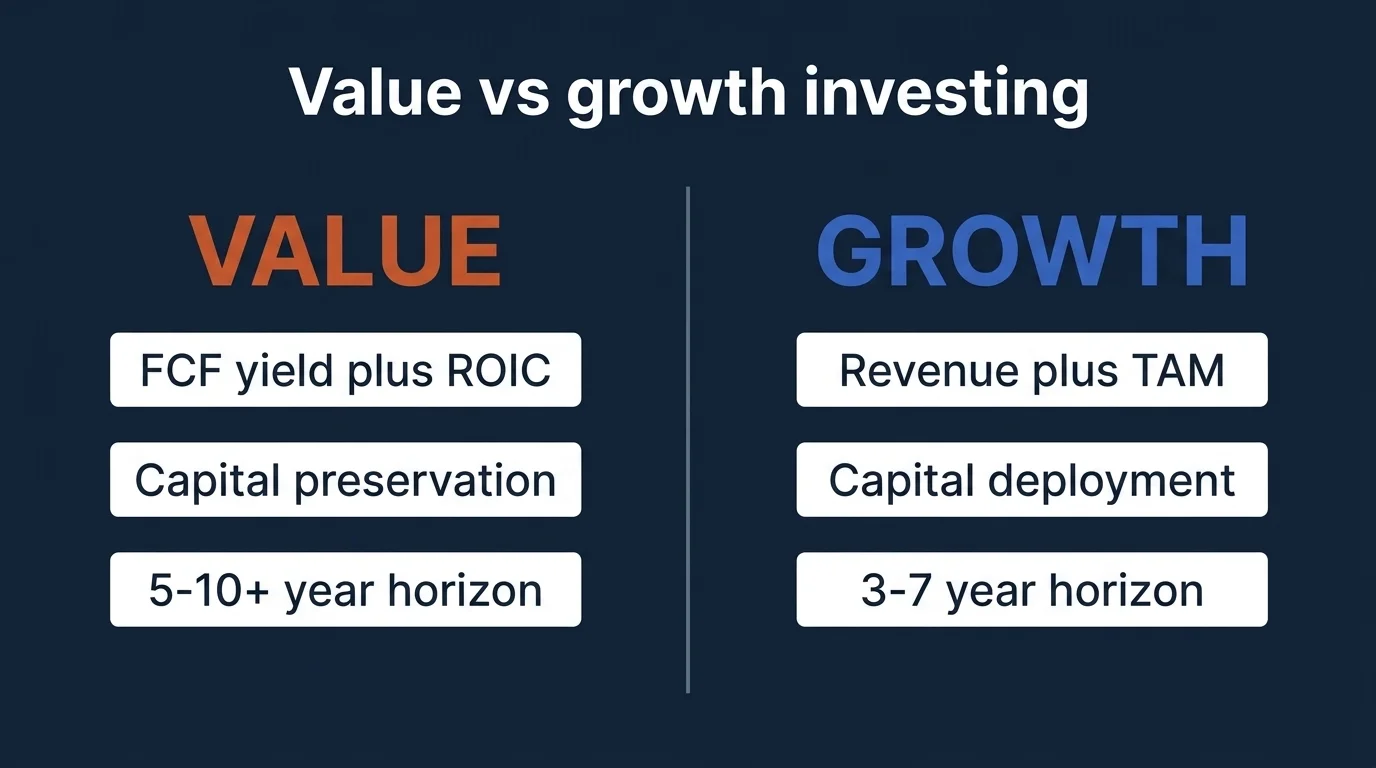
Most value-investing content glosses over the comparison or treats growth as the inferior approach. The honest version is more nuanced.
| Dimension | Value investing | Growth investing |
|---|---|---|
| Time horizon | 5-10+ years typical | 3-7 years typical |
| Primary metric | Free cash flow yield, ROIC, intrinsic value | Revenue growth, TAM expansion, gross margin trajectory |
| Risk posture | Capital preservation; downside discipline | Capital deployment; upside capture |
| Historical edge | Long-run risk-adjusted return premium | Strong in expansion phases |
| Behavioral fit | Investors tolerant of underperformance windows | Investors tolerant of high volatility |
Both approaches work; both fail in different conditions. Growth dominates in expansionary regimes when capital is cheap and TAM matters more than current profitability. Value dominates in tighter regimes when cash flow durability matters more than expansion potential. The 2024-2025 Mag 7 era was a growth regime. The 2026 setup looks more value-friendly, with the caveat that "looks more value-friendly" is not the same as "value will outperform."
A balanced portfolio frequently includes both. The question is not which approach to choose universally, but which approach fits your time horizon, your risk tolerance, and your tolerance for the kind of underperformance windows each approach produces.
What this guide does not tell you
In keeping with how I approach any analytical thesis: here is what I have not addressed and you should not infer.
- Whether to buy any specific stock or fund today. That is between you and a licensed financial advisor who knows your full situation. I have explained the framework. I have not told you to allocate.
- When the value rotation extends or reverses. I do not know. The conditions favoring a value rally are present in early 2026; whether they translate into outperformance on any specific timeline is the open question of the cycle.
- Whether Greg Abel's tenure produces returns comparable to Buffett's. Six months in is not enough data. The next five years will tell us.
- Whether the value-trap framework I described will catch every trap in advance. It will not. Some businesses deteriorate faster than the screening filters detect. The frameworks reduce the rate of error; they do not eliminate it.
What would change my view on the framework above: a sustained breakdown in the long-run risk-adjusted return premium of value over growth across multi-decade horizons; a regime change in how accounting cash flow is measured and reported (e.g., a meaningful expansion of the gap between GAAP earnings and free cash flow that makes FCF yield less informative); or a structural change in how moats erode (e.g., AI competition compressing the durability of historically-defensible network effects). I am watching all three. None has happened.
That is value investing in 2026, framed as I would teach it to a new analyst on day one. Boring discipline. Patient capital. Mathematical rigor. Bright line between businesses that generate real free cash flow from real economic activity and assets whose price moves are correlated with sentiment. Both can make or lose you money. Only one of them is investable in any rigorous sense of the word — and the work of value investing is figuring out, in any given era, which is which.
Frequently Asked Questions
Value investing is the discipline of buying securities at a meaningful discount to their estimated intrinsic value, using fundamental analysis and a margin of safety to protect against analytical error. Warren Buffett retired as Berkshire Hathaway CEO on December 31, 2025, but value investing is a framework, not a person. Greg Abel inherited Berkshire's record $381.6 billion cash position and committed to maintaining the patient, margin-of-safety discipline. Howard Marks remains the most-cited living value practitioner. The principles outlive the practitioners.
Fundamental analysis is the systematic evaluation of a business's economics — revenue durability, cash flow generation, capital structure, competitive position (the economic moat), management quality, and capital allocation. Value investors use it to estimate intrinsic value and compare that estimate to the current market price. When the market price is meaningfully below intrinsic value (typically with at least a 25-33% margin of safety), the security is a candidate for purchase. Fundamental analysis also identifies value traps — stocks that look cheap but whose businesses are in structural decline.
Margin of safety is Benjamin Graham's principle that valuation is approximate, not exact, so investors should buy at materially below their estimated intrinsic value to cushion against analytical error. Graham's quantitative rule was to pay no more than two-thirds of intrinsic value, leaving a 33% cushion. The principle protects investors from inevitable mistakes in any valuation estimate. Berkshire Hathaway's $381.6 billion cash position at end-of-September 2025 is the most prominent contemporary example of margin-of-safety discipline.
A value trap is a stock that looks cheap on metrics like P/E or dividend yield but whose business is in structural decline. Five red flags signal a trap: declining revenue across three or more consecutive years, rising debt-to-equity, a dividend yield that jumped because the price collapsed, institutional investor exodus, and an eroding competitive moat. IBM during the 2012-2020 cloud transition lag and Sears under Eddie Lampert are canonical examples — both screened cheap while their underlying businesses deteriorated.
Free cash flow yield is a company's free cash flow divided by its enterprise value (market capitalization + total debt - cash). It tells you how much real, distributable cash the business produces per dollar of business value. Value investors increasingly prefer it over P/E because earnings can be massaged with accounting choices, while free cash flow is much harder to fake. Interpretation bands: above 10% is deep-value territory, 5-10% is the quality-value sweet spot for durable compounders, below 5% indicates premium pricing.
Value investing focuses on buying durable businesses at meaningful discounts to estimated intrinsic value, prioritizing free cash flow generation and capital preservation. Growth investing focuses on buying businesses with strong revenue and TAM expansion potential, prioritizing future growth over current profitability. Both work; both fail in different conditions. Value generally outperforms in tighter regimes when cash flow durability matters most; growth dominates in expansionary regimes when capital is cheap. A balanced portfolio frequently includes both.