The Evolution of Investment Strategies: Adapting to Changing Market Dynamics


The number worth opening any 2026 conversation about investment strategies with is not the S&P 500 level. It is the roughly 30% price-to-earnings premium that the cap-weighted S&P 500 currently trades at relative to the equal-weight version of the same index — up from approximately 13% before the pandemic. What that gap measures is the valuation premium attached to the small group of names that dominate the cap-weighted index — the so-called Magnificent Seven, which now represent about 34.3% of the S&P 500 as of December 2025, up from 12.3% a decade ago. What it does not tell you is the path: either the premium compresses back toward the historical mean as the rest of the market catches up, or the concentration deepens as the AI capex super-cycle continues to flow disproportionately to those names. The honest investment-strategy question for 2026 is not "is the market overvalued" — that question is unanswerable in any actionable form. The honest question is: given a cap-weighted index whose return for the next five years depends meaningfully on what seven companies do, what does a sensibly constructed portfolio actually look like?
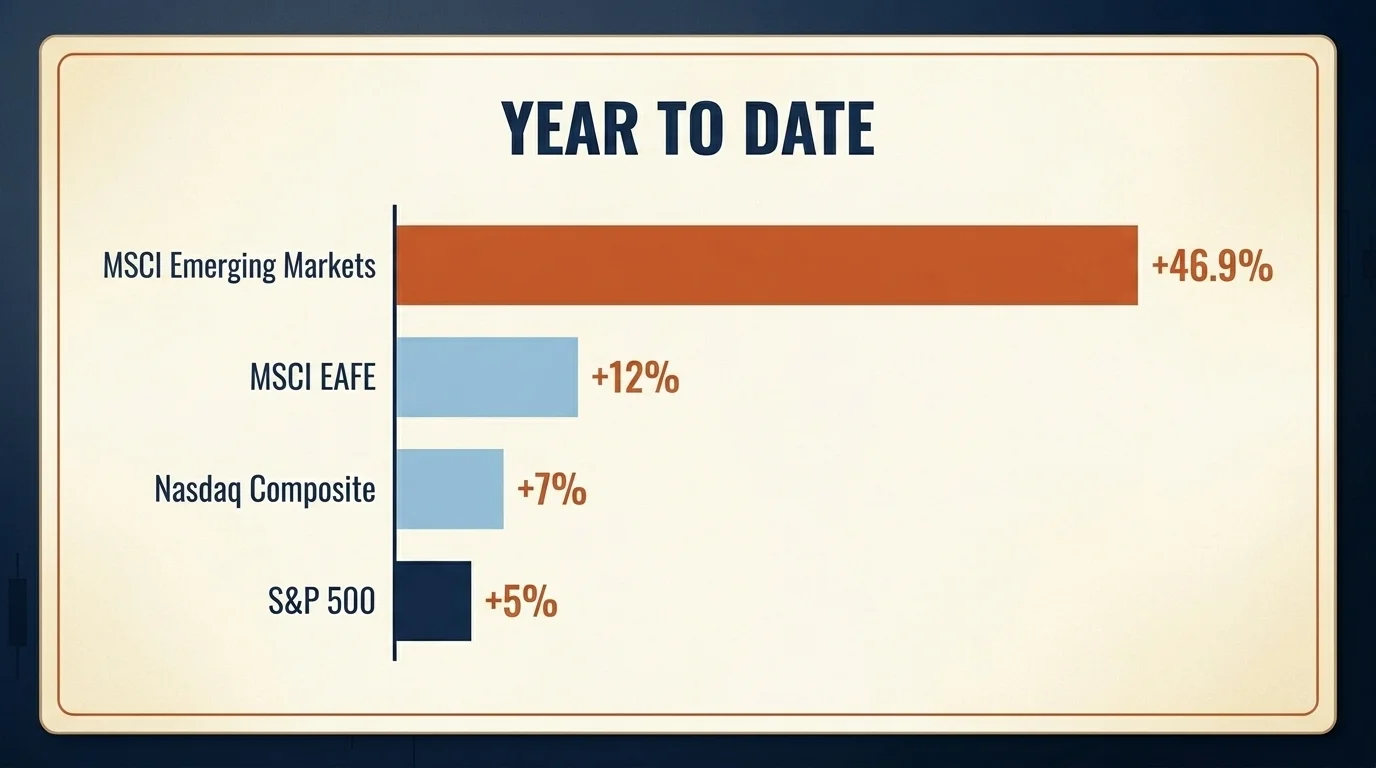
The rest of this article is the disciplined answer. The 2026 macro context that anchors every strategy decision. The named portfolios — 60/40, All-Weather, Permanent, Core-Satellite, the new 40/30/30 with alternatives — with their actual weights. The distinction between strategic, tactical, and dynamic asset allocation, and when each fits. The factor calls for 2026. The AI capex super-cycle and how to think about exposure to it without making a single-name bet. And the international rotation that is already underway — emerging markets up 46.9% year-to-date through early May versus the S&P 500's roughly 5%. There is more to know than fits in any one article; the framework below is the structure to organize the decisions around.
The 2026 Macro Context
Five numbers anchor the May 2026 strategy conversation:
| Indicator | Reading |
|---|---|
| Fed funds target range | 3.50–3.75% (three 2025 cuts; one more projected for 2026) |
| PCE inflation, projected end-2026 | ~2.5% |
| Magnificent Seven share of S&P 500 | ~34.3% (April 2026) |
| MSCI Emerging Markets YTD 2026 vs S&P 500 | +46.9% vs +5% |
| Cap-weighted vs equal-weight S&P 500 P/E premium | ~30% (vs ~13% pre-pandemic) |
What this context tells you: the Fed is mostly done cutting (rates are settling near neutral), inflation is moderating but not fully tamed, US large-cap is unusually concentrated and unusually expensive on a relative basis, and the rest of the world is in the middle of an outperformance run that started in 2024 and accelerated in 2026. The strategic implications follow from those facts; the article below walks through them in order.
The Concentration Problem: Why Diversification Looks Different in 2026
The cap-weighted S&P 500 was historically the textbook example of a diversified portfolio — five hundred large US companies, no single name above ten percent of the index. That is not the index that exists in 2026. The Magnificent Seven — Nvidia, Microsoft, Apple, Amazon, Alphabet, Meta, Tesla — together represent roughly 34% of the index, with Nvidia alone at 7.32%, Apple at 6.49%, and Microsoft at 5.8%. The top 10 names drove more than 58% of the S&P 500's return in 2025, and the top 10 weighting reached a record 40.7%.
What this does to "diversified passive index investing" is straightforward: an investor who owns a cap-weighted S&P 500 fund owns approximately one-third of their large-cap allocation in seven companies, and roughly 13% of it in two stocks. That is a different exposure than the index represented a decade ago, and the disciplined response is to acknowledge it explicitly rather than pretend the index is still doing the diversification work it used to.
The behavior of these names in the last bear market is worth keeping in mind. In 2022 the Magnificent Seven group fell roughly 41.3% versus the index's 20.4% — roughly twice the index drawdown. Concentration cuts both ways: the same names that drove the index's recent outperformance carry meaningfully larger downside in a regime change.
The 2026 institutional response has been a quiet rotation toward equal-weight S&P 500 exposure and toward factor tilts (value, quality, low-volatility) that structurally underweight the most expensive names. The same logic is available to retail investors: own a cap-weighted core, then add a sleeve of equal-weight exposure or a factor-tilted complement that brings the average position size closer to where the historical index actually was. The valuation case for doing it is the 30% P/E premium cited above; the risk-management case is the 2x drawdown beta the Mag-7 group has demonstrated.
Strategic, Tactical, and Dynamic Asset Allocation
Most retail strategy discussions use these three terms interchangeably. They are not synonyms. The clearest way to think about them is by what they hold constant and what they adjust.
| Strategic AA (SAA) | Tactical AA (TAA) | Dynamic AA (DAA) | |
|---|---|---|---|
| Time horizon | Long-term (10+ years) | Medium-term (months to a few years) | Continuous, regime-driven |
| Adjustment frequency | Rebalance only when drift exceeds bands | Periodic tilts around the SAA target | Constant reweighting in response to conditions |
| What it holds constant | Target weights | The strategic baseline | Nothing — the mix moves with the regime |
| Best use case | Default for most retail investors; foundation of every disciplined plan | When you have a defensible view on which asset class is mispriced | Institutional or skilled-tactical investors with edge in regime detection |
| Risk | Drift if not rebalanced | Mistimed tilts can subtract more than they add | Over-trading and over-confidence; usually the worst-performing of the three in retail hands |
The disciplined default for almost every retail investor is SAA with band-based rebalancing — set the long-term mix, rebalance back to it when any sleeve drifts more than a defined percentage from target, and resist the urge to override the framework on a quarterly view. Tactical tilts are a privilege that requires a specific defensible view (a valuation discrepancy, a regulatory catalyst, a macro mispricing) and a willingness to be wrong publicly when the tilt doesn't work. Dynamic allocation in the literal sense — the all-conditions-reactive version — is mostly a marketing term for managers; in retail hands it tends to mean "trade on feeling," which is the failure mode that most behavioral-finance research is documenting.
Five Named Portfolios with 2026 Outlook
The retail strategy conversation often loses readers in abstractions ("balance risk and return") when what is actually needed is a concrete portfolio with named weights. The five below cover most of the practical decision space.
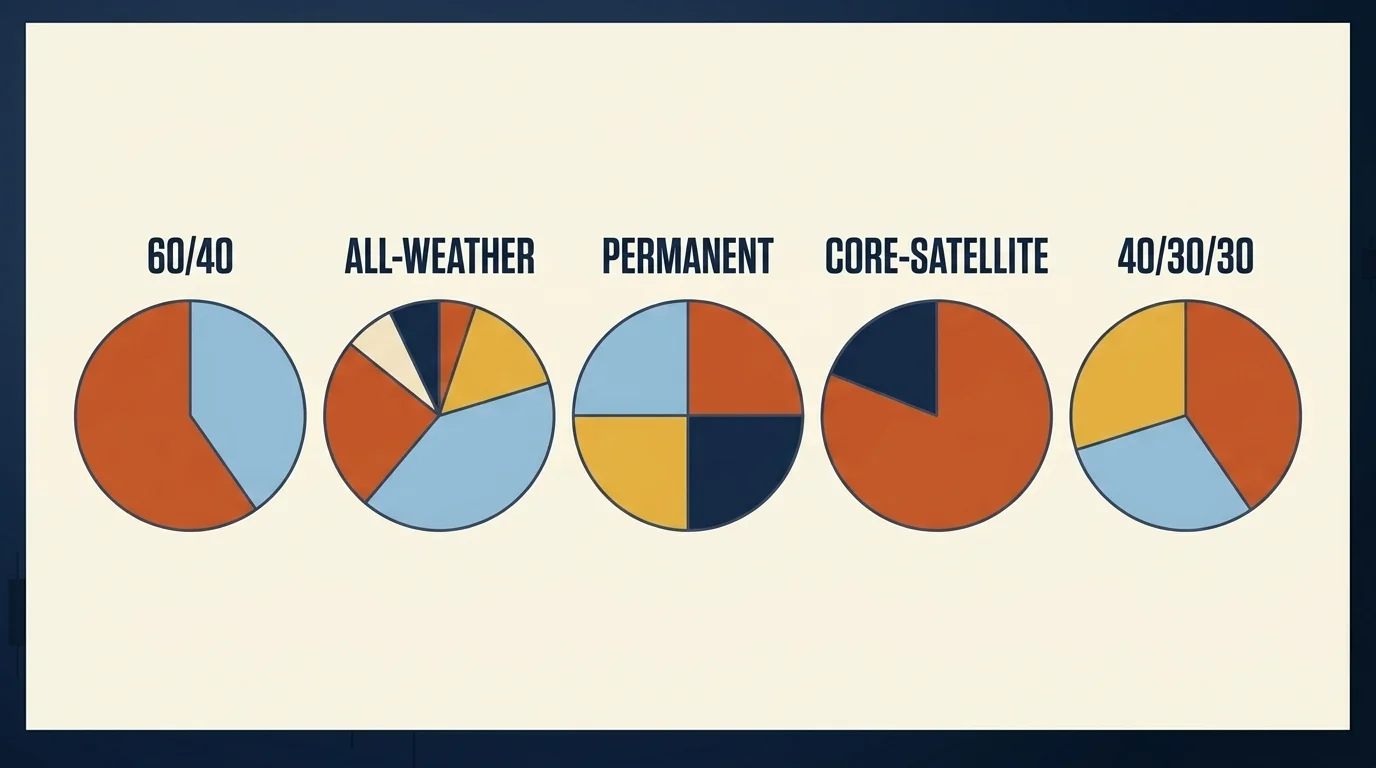
| Portfolio | Allocation | What It's Designed For | 2026 Outlook |
|---|---|---|---|
| 60/40 | 60% equities / 40% bonds (typically intermediate-duration aggregate) | Balanced accumulation through normal cycles | Rehabilitated after 2022 — higher bond yields have restored the diversification benefit. Liquid-alts overlay can lift returns to ~9.2% at lower vol. |
| All-Weather (Dalio) | 30% equities / 40% long-term Treasuries / 15% intermediate Treasuries / 7.5% gold / 7.5% commodities | All four economic regimes (growth/inflation up or down) | Long-bond sleeve more attractive than in zero-rate era; lower long-run CAGR than 60/40 but materially smaller drawdowns. |
| Permanent (Browne) | 25% stocks / 25% long-term Treasuries / 25% gold / 25% cash | Maximum simplicity, maximum drawdown protection | Defensive by design; long-run CAGR notably below equity-heavier portfolios. Reasonable for very risk-averse investors. |
| Core-Satellite | 80% passive core (broad-market index) / 20% active sleeve | Index-fund discipline with targeted active bets | The active sleeve is where factor tilts, alternatives, or thematic exposure live; the core does the diversification work. |
| 40/30/30 (modern) | 40% equities / 30% fixed income / 30% alternatives (private credit, real assets, managed futures) | Post-60/40 framework that integrates alternatives as a third sleeve | The institutional reframe; retail access has improved sharply with interval funds and the SEC's August 2025 ADI shift. |
A short note on each: 60/40 broke in 2022 because the inflation shock made bonds correlate positively with stocks; it has been quietly rehabilitating since. All-Weather and Permanent are explicitly regime-diversified — they hold gold and Treasuries specifically because those assets do well when equities do not. Core-Satellite is the framework most index-fund-first investors actually run, even if they do not name it. 40/30/30 is the institutional response to the 60/40 break — the third sleeve does the diversification work that bonds-and-stocks alone could not in the 2020s inflation shock.
The honest framing for selection: pick the portfolio you can hold through the worst three-year stretch it will experience. Look at the historical drawdown numbers, not just the expected returns. A portfolio whose terminal value is higher on paper but whose 2008 or 2022 experience would have caused you to sell at the bottom has, in practice, the lower expected return — because you would not have held it.
Related Article: Finance Mentor vs Sponsor: What Actually Compounds a Career
The 60/40 Reset: What Broke and What Replaced It
The 60/40 portfolio's 2022 calendar year return of approximately -17% was its worst since 1937 — fourth-worst in 200 years. What broke was the assumption underlying the strategy: that bonds would hedge equities during a stress event. In 2022 the inflation shock drove correlation positive — bonds and stocks fell together — and the diversification mechanism stopped working precisely when it was needed.
Since 2020, bond returns have been negative in 17 of 19 months when equities fell 2% or more. That is a structural feature of inflation regimes, not a transient episode, and any honest discussion of 60/40 has to acknowledge it.
What replaced 60/40 in institutional portfolios is not a wholesale rejection — it is the addition of a third sleeve. The Apollo / BCG / iCapital framing is 40/30/30: 40% equities, 30% fixed income, 30% alternatives. The alternatives sleeve does the diversification work the bond sleeve cannot reliably do in inflationary periods, drawing from private credit, real assets, managed futures, and other low-correlation strategies. Adding 20% liquid alts to a traditional 60/40 has historically lifted returns from 6.7% to roughly 9.2% while cutting volatility from 11.6% to 9.3% — the lift comes from the structural diversification, not from outperformance of any single alts manager.
For most retail investors, the practical implication is to consider an alternatives allocation in the 10%–20% range, sourced from interval funds, managed-futures ETFs, and real-estate or commodity ETFs depending on the specific diversification you are targeting. The exact mix depends on what you already own and what you are most concerned about going wrong.
Factor Investing in 2026: Value, Momentum, Quality
Factor investing is the systematic version of the value-versus-growth debate, and 2026 is an interesting moment in the factor cycle. J.P. Morgan Asset Management's Q1 2026 factor views call:
- Value: Positive. US value is "nearly as inexpensive as the dot-com era" relative to growth.
- Momentum: Neutral with a caution flag. Intra-factor dispersion is the widest since 1990, which has historically signaled crash risk in the factor.
- Quality: Neutral, close to upgrade.
- Size, low-volatility: Mixed, situation-dependent.
The mainstream factor menu has stabilized at five: size (small-cap premium), value (cheap-to-fundamentals premium), momentum (recent-winner premium), quality (high-profitability/low-debt premium), and low-volatility (stable-returns premium). Each has academic foundation (Fama-French, Carhart, Asness), each has a long history of period-specific outperformance and underperformance, and each is investable in ETF form at expense ratios typical of single-factor smart-beta vehicles.
The honest case for factor tilts in 2026: the Mag-7 concentration cited above is structurally a momentum-and-quality-tilted bet. An investor who wants to dilute that concentration without giving up large-cap exposure can pair the cap-weighted core with a value tilt (which underweights the most expensive names by construction), or with an equal-weight ETF (which mechanically distributes weight more evenly across the index). The combined effect is to bring the portfolio's effective factor exposure closer to the historical mean, at a fee load that is competitive with the underlying index funds.
What factor investing is not is a market-timing tool. The factor regimes are slow — value can underperform for a decade before reverting, as it did across the post-GFC growth run — and the discipline that makes factor exposure work is holding through the underperformance. Treat factor tilts as long-horizon allocation decisions, not quarterly trades.
Related Article: Youth-Led Financial Revolutions: Crowdsourcing as a Catalyst for Investment Innovation
Investing in the AI Capex Super-Cycle
The single biggest investment-narrative story of 2025 and 2026 is the AI capital expenditure cycle. Combined hyperscaler capital expenditure across Amazon, Alphabet, Microsoft, Meta, and Oracle exceeds $600 billion for 2026 — a 36% increase from 2025. Roughly $450 billion, or 75% of that total, flows into AI infrastructure (GPUs, servers, networking, data centers). Nvidia captures approximately 90% of the accelerator spend.
This is the largest concentrated capital deployment in the history of the technology industry. The disciplined question to ask about it is the same valuation question that applies to any investment thesis: at what price does the assumed return on this capex justify the multiples the names involved are trading at? The bear case is that the capex assumes a long-tail revenue stream that may not materialize at the magnitude implied; the bull case is that AI productivity gains will flow through to the broader economy and justify both the capex and the multiples. Both are defensible; neither is provable from where we sit.
The practical strategy decomposition for retail investors:
- AI as sector exposure. Most diversified S&P 500 funds already provide meaningful AI exposure through their Mag-7 weight. Adding a concentrated AI thematic ETF on top duplicates exposure to the same handful of names; recognize that before sizing the position.
- AI in adjacent sectors. The capex flow reshapes utilities (power demand), semiconductors (chip fabrication and packaging), industrial infrastructure (cooling, electrical, real estate). An investor who wants AI exposure without single-stock concentration risk can express it via sector ETFs in utilities, semis, and infrastructure, which capture the spending without the headline-stock valuation premium.
- AI bubble caution. Roughly 23% of credit investors flag an AI bubble as their top portfolio concern. The disciplined response is to size AI exposure such that a 30%–50% drawdown in the concentrated names does not break the broader portfolio. That sizing discipline matters more than the exact path of AI commercialization.
What would change my view on the AI capex thesis? Two consecutive years in which incremental ROIC at the hyperscalers fell below their cost of capital on the AI investment specifically. Not a single bad quarter — quarterly noise. Two years of cost-of-capital-busting incremental returns would tell me the capex cycle had committed capital to projects whose terminal returns do not justify the spend, and the equity premium attached to the Mag-7 group would be at structural risk of compressing.
Going Global: The International Rotation of 2026
The most underdiscussed development of 2026 to date is the magnitude of international outperformance. The MSCI Emerging Markets Index returned approximately 46.9% year-to-date through early May 2026; the S&P 500 returned about 5% over the same window. That gap is dramatic enough to be the single most important asset-allocation signal of the year.
The valuation backdrop supports the rotation: non-US equities currently trade at approximately a 35% forward P/E discount to US equities, and emerging-market earnings growth in 2026 is projected near 20% versus roughly 12% for the US. The AI supply chain runs through emerging-market companies — Samsung and SK Hynix in memory, TSMC in chip fabrication — meaning international equity is partly an AI-exposure play in disguise, at materially cheaper valuations than the equivalent US exposure.
The disciplined response is not to abandon US equities but to increase the international weight. Most retail portfolios hold US-equity-heavy allocations (often 70%–90% of the equity sleeve), which is a strong home-country bias against a global-market-cap-weighted alternative that would put US closer to 60%. A move toward the global-market-cap weight, with some explicit emerging-market tilt given the valuation gap, is the textbook disciplined response to the data.
What this does not tell you is whether the rotation is durable. International outperformance has had several false dawns over the last decade — the 2017 EM run that reversed in 2018, the 2020 EM rally that gave back. The case for treating the current rotation as more structural rests on the valuation gap (real and meaningful), the EPS growth differential (real and meaningful), and the AI supply-chain exposure embedded in international names. The honest framing is to treat it as a multi-year allocation thesis, not a 2026 trade.
Related Article: Red vs. Blue: The Battle of Colors in Investment Marketing
Alternative Investments: The Retail-Alts Shift
The 2025–2026 retail-alts opportunity is the most significant change in retail portfolio construction in a decade. The SEC's August 2025 update to the Allowable Direct Investments rule removed the 15% cap on private-fund assets inside retail registered funds. Private credit alone is a $1.5–2 trillion market forecast to reach $3 trillion by 2028. BCG estimates $3 trillion in wealth-investor flows into private markets between 2024 and 2030.
The practical menu for retail investors:
- Private credit interval funds — Hamilton Lane HLCIF, the Vanguard/Blackstone/Wellington WVB All Markets Fund, and similar wrappers. Quarterly liquidity, $2,500–$25,000 minimums, target distributions of 8%–11%.
- BDCs (publicly traded) — VanEck's BIZD and individual BDC names. Daily liquidity, no accreditation gate, current index-level dividend yields around 11%.
- Managed-futures ETFs — DBMF and category alternatives. Crisis-alpha properties; low equity correlation.
- Real assets — REITs (VNQ), commodity ETFs (DBC, GLD), farmland and infrastructure platforms.
The sizing discipline: alternatives are a 10%–20% allocation at most for typical retail portfolios, sourced from the bond sleeve or from a reduction in the cap-weighted equity sleeve. The structural reason is the same as the case for the 40/30/30 portfolio cited above — the diversification benefit of the alts sleeve is real, but the liquidity, fee, and complexity costs are also real. Size accordingly.
Strategy Evolution Timeline
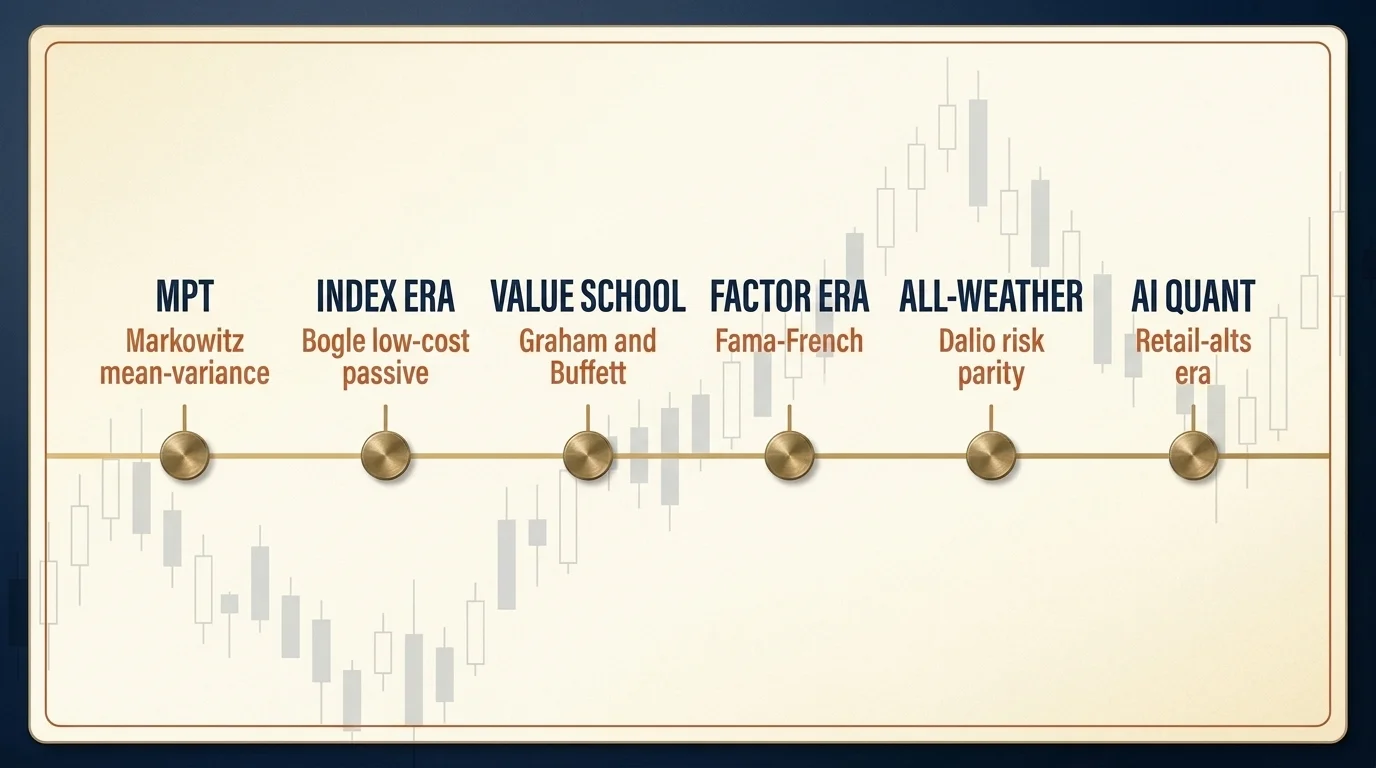
The "evolution of investment strategies" framing in the original article was directionally right — the field has actually evolved, and the lineage is worth knowing because each generation answered a problem the previous one could not.
- 1952 — Harry Markowitz and Modern Portfolio Theory. The efficient frontier, the case for diversification as the only free lunch in finance, the foundation underneath every later framework.
- 1976 — John Bogle and indexing. The empirical case that most active managers fail to beat their benchmark after fees, the launch of the first index mutual fund, and the long compounding case for low-cost passive ownership.
- Postwar — Benjamin Graham and Warren Buffett: value investing. The discipline of buying at a margin of safety to intrinsic value, the case against speculation, the framework that anchors most concentrated long-only equity strategies.
- 1990s — Fama-French factor models. The empirical decomposition of equity returns into size and value premia, later extended by Carhart (momentum), Asness, and the broader factor literature.
- 1990s–2000s — Ray Dalio and the All-Weather framework. The case for regime-diversified portfolios — building a mix that performs across the four combinations of growth and inflation, rather than betting on one outcome.
- 2010s — Smart beta and ETF democratization. Factor exposures wrapped in ETF form, available to retail at 0.10%–0.35% expense ratios.
- 2020s — AI, quant, and retail-alts. The current era: AI capex super-cycle as a regime-defining feature, AI-driven quant strategies, and the opening of private markets to retail investors via interval funds and registered alternatives.
Each generation built on the previous one. Modern Portfolio Theory is still the foundation; the additions are factor decomposition, regime diversification, and the integration of alternatives. The disciplined investor in 2026 uses all of it: an index-based core, a factor tilt informed by the academic literature, regime diversification informed by Dalio's framework, and an alternatives sleeve informed by the institutional reframe.
Macro Tail-Risk Watch: What If Inflation Doesn't Cooperate?
The base case for 2026 — Fed at 3.50%–3.75%, inflation moderating to 2.5%, one more cut on the way — is the consensus, which means it has consensus probability of being roughly right and meaningful probability of being wrong. The specific tail risk worth carrying explicit exposure for is the stagflation scenario: inflation re-accelerating while growth slows, the regime that broke 60/40 in 2022.
The hedges that work in stagflation are not the same hedges that work in pure inflation. Gold and broad commodities provide partial protection. TIPS protect against unexpected inflation directly. The All-Weather and Permanent portfolios above are structurally designed for this regime, which is the case for them as a sleeve even if the base case does not require it. A 5%–10% allocation across gold, commodities, and TIPS — sized small enough that it does not drag the portfolio in a normal-growth scenario, large enough that it materially helps in a stagflation outcome — is the disciplined version of carrying the tail risk.
What Would Change My View
The thesis underneath this article is that the right 2026 portfolio for a typical retail investor combines a cap-weighted equity core with an equal-weight or factor-tilted complement (to dilute Mag-7 concentration), an international tilt that recognizes the valuation gap and the AI supply-chain exposure, a rehabilitated 60/40 framework with an alternatives sleeve in the 10%–20% range, and a small tail-risk hedge against stagflation. The strategic asset allocation is the foundation; tactical tilts are reserved for situations where there is a defensible valuation view; dynamic allocation in the literal sense is mostly a marketing term.
What would change my view? One thing, specifically: a regime in which the AI capex thesis demonstrates persistent ROIC compression at the hyperscalers — incremental returns below cost of capital for two consecutive years — while inflation simultaneously re-accelerates beyond 4% on a 12-month basis. That combination would invalidate both the equity-concentration thesis (because the multiples attached to the Mag-7 group would no longer be defensible on forward fundamentals) and the bond-recovery thesis (because higher inflation would drive correlation positive again and break the 60/40 reset). In that regime, the alts and tail-risk sleeves would do most of the work, and the cap-weighted equity exposure would need to be cut further. Until I see either of those signals firm up in the data, the framework above looks like the right balance for the regime we actually have.
I am watching three things specifically: trailing-12-month hyperscaler ROIC on the AI investment specifically, the cap-weighted-versus-equal-weight P/E premium, and the realized-versus-expected inflation gap. That combination, not any single number, is what would tell me the regime has changed.
This article is for educational purposes only and is not individual financial advice. Portfolio frameworks, factor calls, and macro outlooks change with new data; the specific allocation that fits your situation depends on variables — risk tolerance, time horizon, tax situation, existing holdings — that no general article can address. Consult a licensed financial advisor for guidance matched to your specific circumstances, and read each fund's prospectus before allocating capital.
Frequently Asked Questions
There is no single best strategy — the right one depends on your time horizon and risk tolerance. In 2026 most advisors are pairing a diversified core (60/40 or 40/30/30 with alternatives) with factor tilts toward value and quality, given that the Magnificent Seven now account for ~34% of the S&P 500 and equal-weight indices began outperforming in late 2025.
Yes — with caveats. After its worst year since 1937 (-17% in 2022 when stocks and bonds fell together), higher bond yields have rehabilitated the strategy. Many advisors now run a 40/30/30 (equity / fixed income / alternatives) instead, or layer 20% liquid alts onto a 60/40 base, which has historically lifted returns from ~6.7% to ~9.2% at lower volatility.
Strategic asset allocation (SAA) sets long-term target weights and rebalances back to them. Tactical asset allocation (TAA) makes deliberate shorter-term tilts away from those weights to exploit market views. Dynamic asset allocation (DAA) continuously adjusts the entire mix in response to changing risk-return conditions. SAA is the foundation, TAA is the active tilt, DAA is the most reactive of the three.
Ray Dalio's All-Weather portfolio holds roughly 30% stocks, 40% long-term bonds, 15% intermediate bonds, 7.5% gold, and 7.5% commodities — designed to perform across all economic regimes. With the Fed holding rates near 3.5–3.75% and inflation easing toward 2.5%, the long-bond sleeve is more attractive than in the zero-rate era.
The Mag 7 now represent ~34% of the S&P 500 (up from 12% a decade ago) and drove 58%+ of the index's 2025 return. In the 2022 bear market they fell ~41% vs the index's ~20%. Common 2026 responses are pairing a cap-weighted holding with equal-weight S&P 500 exposure or adding factor-tilted ETFs (value, quality) to dilute the concentration.
AI is no longer just a single-stock bet — Big Tech hyperscalers are spending over $600 billion on AI infrastructure in 2026, reshaping sectors from utilities to semiconductors to power generation. Institutional investors are split: 23% of credit investors call an AI bubble their top concern, while equity managers note earnings still support the capex. A balanced response: own AI exposure through diversified tech and equal-weight indices, not concentrated single-name bets.
They have been so far. The MSCI Emerging Markets Index gained 46.9% through early May 2026 while the S&P 500 returned about 5%. Non-US stocks trade at roughly a 35% forward P/E discount to US, and emerging-market companies anchor key links in the AI supply chain (SK Hynix and Samsung in memory, TSMC in chip fabrication). Most strategists recommend increasing international exposure, not abandoning US.
Factor investing tilts a portfolio toward characteristics that have historically delivered excess returns — value, momentum, quality, size, and low volatility. J.P. Morgan's Q1 2026 factor outlook calls value positive (US valuations 'nearly as inexpensive as the dot-com era'), momentum neutral with a crash-risk flag (intra-factor dispersion is the widest since 1990), and quality near an upgrade.
Yes — far more easily than five years ago. The SEC's August 2025 ADI update removed the long-standing 15% cap on private-fund assets inside retail registered funds, and interval funds, evergreen structures, and BDCs now offer lower minimums and periodic liquidity. Direct lending alone has grown to $1.5–2 trillion and is forecast to hit $3 trillion by 2028. The trade-off is liquidity and complexity — most retail investors keep alts to 10–20% of portfolio.
The 40/30/30 is the modern reframe of the classic 60/40: 40% equities, 30% fixed income, 30% alternatives (private credit, real assets, managed futures). It addresses the structural weakness 60/40 demonstrated in 2022 by adding a third diversification sleeve that does not depend on stock-bond correlation being negative. Apollo, BlackRock, and other major asset managers have published versions of this framework.