Impact of Inflation on Investment Strategies


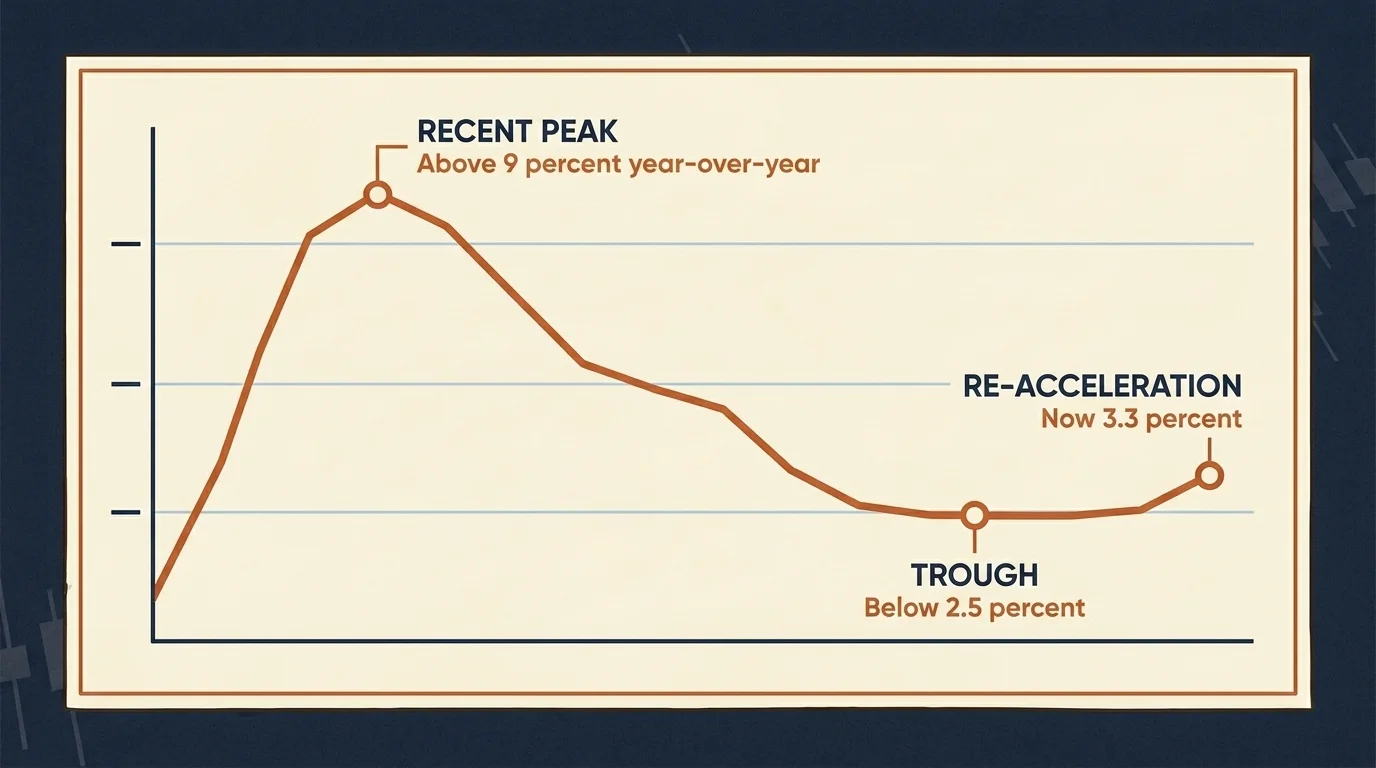
The number worth looking at this quarter is the one that tells you whether stagflation 2026 is real or a head fake: the March 2026 Consumer Price Index print at 3.3% year-over-year, up from 2.4% a year earlier, with monthly inflation averaging 0.4% in 1Q 2026 versus 0.2% in 4Q 2025. What that measures is the average price change across a representative basket of urban-consumer goods and services, weighted by how households actually spend. What it does not tell you is whether the re-acceleration is a base effect rolling through, a genuine cost-push from the energy spike (energy CPI is +12.5% year-over-year versus -3.3% a year earlier), or the beginning of a broader stagflation episode — and that is precisely the question the rest of this article is for.
The 2026 Inflation Snapshot
Five numbers anchor the May 2026 inflation conversation. Treat them as the live data the rest of the strategy decisions are made against.
| Metric | Reading | As of |
|---|---|---|
| Headline CPI (year-over-year) | 3.3% | March 2026 print |
| Fed funds target range | 3.50%–3.75% (paused for 3rd consecutive meeting, four-way dissent) | April 29, 2026 FOMC |
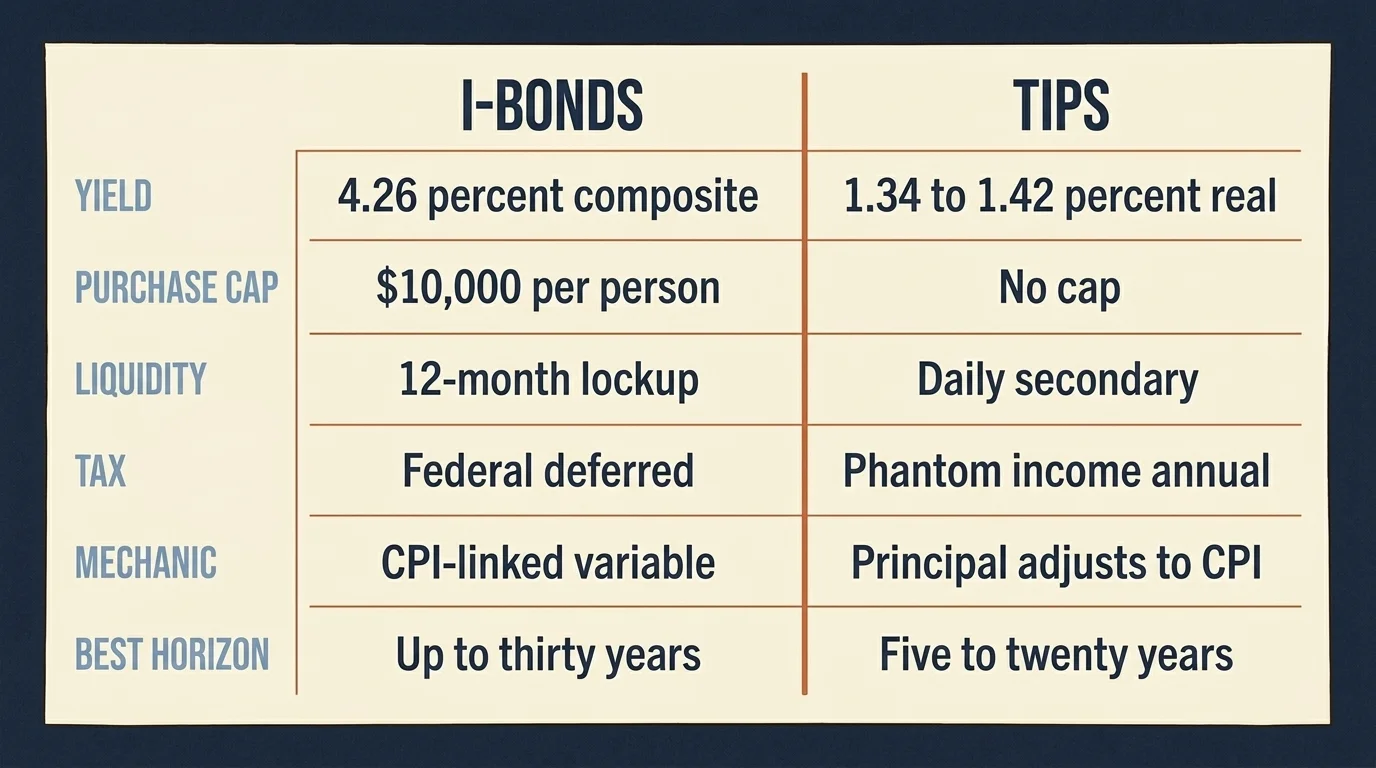
| I-bond composite rate | 4.26% (0.90% fixed + 3.34% variable) | May 1, 2026 reset |
| 5-year TIPS real yield | 1.34%–1.42% | Late April 2026 |
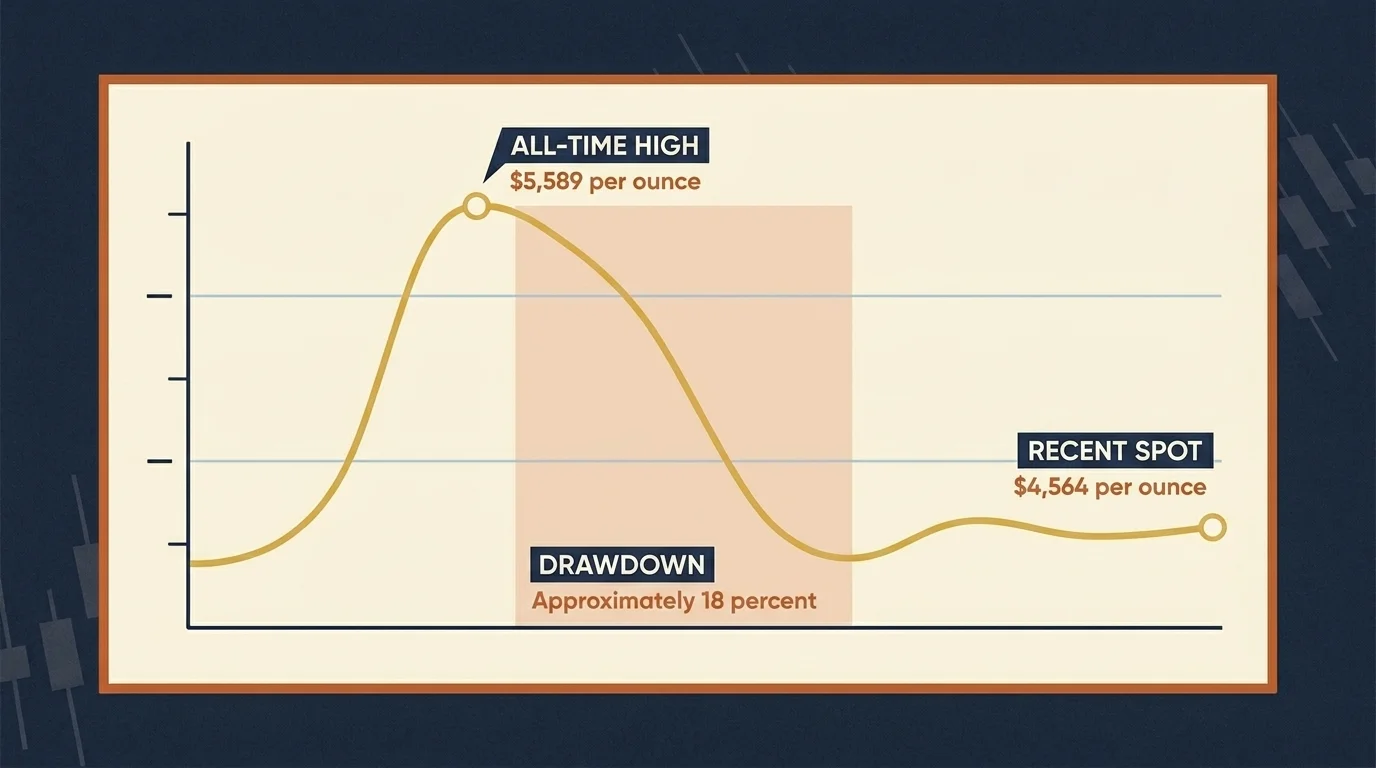
| Spot gold | $4,564/oz (down 18% from $5,589 January ATH) | May 5, 2026 |
What this snapshot does not tell you is the path. It does not say whether the Fed cuts in the back half of 2026 (Goldman Sachs Research projects two cuts; the FOMC's own April dot plot is split), whether the energy contribution to headline CPI is durable or transient, or whether the labor market softening that has Powell openly using the word "stagflation" in press conferences is the early innings of something or a head fake. The honest framing for an allocator is that the regime is unsettled, and the right portfolio under an unsettled regime is one that holds up across more than one outcome.
What CPI Measures (and What It Does Not)
CPI is a price index, not a wealth measure. A 3.3% year-over-year reading means the average urban-consumer basket costs 3.3% more than it did twelve months ago. Two things follow mechanically: any savings or fixed-rate income stream loses 3.3% of real purchasing power over that year, and any portfolio return below 3.3% nominal is a real loss — the green print on a brokerage statement does not change that.
What CPI does not measure: your specific cost of living (which depends on whether your spending is weighted toward energy and food versus housing versus discretionary), the wealth effect of asset-price changes (CPI ignores asset prices entirely), and the distributional reality that the price increases hit lower-income households harder because they spend a higher share of income on the goods CPI weights heaviest. When financial press uses "inflation" without qualifier, they usually mean CPI; treat that as a starting point, not a complete description.
The implication for investment strategy is narrower than the headline conversation usually suggests. You are not trying to "beat inflation" in the abstract — you are trying to design a portfolio whose after-tax, after-fee real return is positive over your actual holding period, in the regime you are in, with the cash-flow needs you actually have. Most of the rest of this article is about which instruments do that job under which conditions.
Stagflation vs Inflation: Two Different Playbooks
Stagflation is the term to get clear about, because the playbook is genuinely different from a pure inflation regime. Stagflation means elevated inflation and stagnant or contracting real growth at the same time — the 1970s combination that broke a generation of asset-allocation assumptions. The reason the word is back in serious circulation in 2026 is that the Fed Chair is openly using it, and Wall Street strategists are revisiting the 1970s parallel for the first time in 18 months. What "stagflation 2026" describes is the specific risk that the energy-driven CPI bump combines with the labor-market softening already visible in the data, leaving the Fed without a clean policy response.
The playbook differs from pure inflation in a few measurable ways:
| Regime | What tends to win | What tends to lose |
|---|---|---|
| Inflation (rising prices, growth holding) | TIPS, I-bonds, broad equities (especially earnings-resilient sectors), REITs with rent reset, commodities, value over growth | Long-duration nominal bonds, cash in real terms, high-multiple growth equities |
| Stagflation (rising prices, growth stalling) | TIPS, I-bonds, defensive sectors (energy, staples, healthcare), gold and other real assets, value, dividend aristocrats, short-duration credit | Long-duration nominal bonds, long-duration high-multiple equities, cyclicals, broad credit if defaults rise |
The overlap is real — TIPS, I-bonds, and defensive equities show up in both columns — but the relative weight shifts. In pure inflation, broad equities still tend to deliver positive real returns because nominal earnings keep up; in stagflation, the earnings component compresses, which is why Wellington and other allocators specifically flag defensive sectors and inflation-linked bonds for stagflation regimes rather than broad equity exposure. What this framework does not tell you is which regime you are actually in until you have at least two more quarters of CPI and growth data to compare against. The honest planning move is to size positions that survive both outcomes rather than betting the portfolio on one.
Best Inflation Hedges, Ranked
The instruments below are the legitimate inflation-hedge toolkit available to a U.S. retail investor in 2026. Ranked is the wrong frame — they are different jobs in a portfolio, and the right question is which combination matches your time horizon and tax situation.
| Hedge | How it works | Typical real yield / hedge mechanic (May 2026) | Liquidity | Key risk |
|---|---|---|---|---|
| I-Bonds (Series I) | Treasury savings bond, principal indexed to CPI semi-annually | 4.26% composite (0.90% fixed + 3.34% inflation) | 12-mo lockup; 3-mo interest forfeit if redeemed in years 2–5 | $10k/yr SSN purchase cap |
| TIPS (direct) | Treasury bond, principal adjusts with CPI; coupon on adjusted principal | 1.80%–2.10% real yield intermediate-to-long; 1.34%–1.42% at 5-yr | Daily secondary-market liquidity | Taxed annually on phantom inflation accrual — IRA-friendly, taxable-account drag |
| TIPS ETFs (SCHP, VTIP, TIP) | Pooled TIPS exposure in a daily-liquid wrapper | Tracks underlying real yield minus expense ratio | Daily | Duration risk — short-duration VTIP reacts faster to inflation surprises than longer-duration SCHP/TIP |
| REITs (VNQ, REZ) | Landlords reset rents to inflation contractually or annually | VNQ ~3.5%–4% yield, 12-mo total return ~13% | Daily | Interest-rate sensitive; 5-yr lag vs S&P |
| Gold (GLD, IAU, physical) | Real asset; historically rises when real yields fall | Spot $4,564 May 5, 2026; bank year-end targets $5,400–$6,300 | Daily (ETF) | Inflation correlation is condition-dependent — it can fall during inflation |
| Broad commodities (DBC, PDBC) | Futures basket tracking energy, metals, agriculture | Not a target-return product; inflation-tracking with contango drag | Daily | Roll yield in flat-spot markets; expense ratio 0.85%+ |
| Value / dividend equities (SCHD, VYM, XLE, XLP) | Pricing power and earnings-resilient cash flows | Sector- and stock-specific | Daily | Compressed earnings in stagflation; not a clean inflation hedge in isolation |
| Defensive sectors (XLV healthcare, XLP staples) | Inelastic demand; cost-pass-through | Sector- and stock-specific | Daily | Crowded trade if the regime call is consensus |
The cleanest way to read this table is by hedge mechanic first, then by liquidity. An instrument that hedges CPI directly (TIPS, I-bonds) does a different job than an instrument that correlates with the inflationary economy (REITs, value equities) than an instrument that hedges the macro environment that produces inflation (gold, broad commodities). A diversified hedge sleeve covers more than one of these mechanics; a sleeve that owns three flavors of "real assets that go up when CPI does" is less diversified than it looks.
Related Article: Finance Mentor vs Sponsor: What Actually Compounds a Career
I-Bonds at 4.26%: How They Work and the $10k Cap
I-bonds are Treasury savings bonds with two interest components: a fixed rate that stays with the bond for its 30-year life, and a variable inflation rate that resets every six months. The May 1, 2026 reset held the fixed rate at 0.90% and set the variable component at 3.34%, producing a 4.26% composite rate — up from 4.03% in the prior window. What "composite" actually means in the Treasury formula is the fixed and variable rates compounded, applied semi-annually, with the variable rate adjusting every six months based on the latest CPI-U data.
The structural features matter more than the headline rate:
- Purchase cap: $10,000 per Social Security Number per calendar year through TreasuryDirect, plus an additional $5,000 if applied to a paper bond purchased with a federal tax refund. A married couple can therefore double the per-SSN cap, with each spouse's allocation independent of the other.
- Lockup: 12 months from purchase, no exceptions. Years 2–5: redemption forfeits the most recent three months of interest. After year 5: full redemption with no forfeit.
- Tax treatment: Federal-only (state and local exempt). Interest accrual is deferred until redemption or maturity — a meaningful advantage over TIPS in a taxable account.
- Holding limit: 30-year maturity; interest stops accruing thereafter.
The honest framing for an allocator: I-bonds are an outstanding hedge for the first $10k per person per year, and a poor hedge for anything above it. Used right, they are the safest dollar-denominated way to track inflation with a Treasury credit profile. Used as a primary portfolio sleeve, the purchase cap means they cannot scale with the position you need.
TIPS and TIPS ETFs: SCHP, VTIP, TIP
Treasury Inflation-Protected Securities are the institutional version of the I-bond mechanism: U.S. Treasury bonds whose principal adjusts up (and down) with the CPI-U, with a fixed coupon paid on the adjusted principal. Direct TIPS have no purchase cap and trade daily in the secondary market, but they have one structural drag in a taxable account — the inflation adjustment is taxed annually as ordinary income even though you receive it only at maturity. This is the "phantom income" problem that makes TIPS materially more attractive in IRAs and 401(k)s than in taxable brokerage accounts.
For most retail allocators the practical question is which TIPS ETF to use. The three serious options as of May 2026:
| Ticker | Issuer | Expense ratio | AUM (approx) | Duration profile | Use case |
|---|---|---|---|---|---|
| SCHP | Schwab | 0.05% | ~$25B | Intermediate (~7 yr) | Default core TIPS position; lowest expense ratio in category |
| VTIP | Vanguard | 0.07% | ~$12B | Short (~2–3 yr) | Faster reaction to short-term inflation surprises; lower duration risk |
| TIP | iShares | 0.20% | ~$30B+ | Intermediate-to-long (~7–8 yr) | Longest-tenured benchmark; highest expense ratio of the three |
The duration choice matters as much as the issuer choice. VTIP's short duration means it reacts quickly to CPI surprises but earns less real yield carry; SCHP's intermediate duration adds carry but also adds rate sensitivity, so it can drop in price during a rising-real-yields environment even while the inflation component works in your favor. TIP is the original benchmark and the most expensive of the three; there is no obvious reason to pay 0.20% for what SCHP delivers at 0.05% unless you specifically want the longest duration in the category.
The decision flow most retail allocators actually need is short: max out I-bonds for the first $10,000/year of inflation hedging per person, hold SCHP or VTIP in an IRA for anything above that, and skip TIPS in a taxable account unless the after-tax math has been worked through with an advisor.
Related Article: Youth-Led Financial Revolutions: Crowdsourcing as a Catalyst for Investment Innovation
Real Assets: REITs, Gold, Commodities
Real assets hedge inflation indirectly — they correlate with the inflationary economy rather than tracking CPI mechanically. That distinction is the difference between a clean hedge and a thesis trade.
REITs. Real estate investment trusts hold income-producing property; rents reset to inflation contractually in commercial leases and annually in most residential property. The Vanguard Real Estate ETF (VNQ) yields roughly 3.5%–4% as of May 2026 with a 12-month total return near 13%, though the sector has lagged broad equities over the prior five years — VNQ up roughly 2.6% versus the S&P up 85% — and is positioned for a tailwind if the Fed resumes cutting in the back half of 2026. The rent-reset mechanic is the actual inflation hedge here; the dividend yield is the reason the position holds up in a flat-rate environment. The risk is straightforward: REITs are interest-rate-sensitive, which means they can underperform precisely during the period when the inflation hedge looks most necessary.
Gold. Gold's 2026 round-trip is the cleanest case study available for why gold is not a mechanical inflation hedge. Spot price hit an all-time high of $5,589/oz in January 2026 and fell more than 18% to $4,564 by May 5 — over $1,000 lost in under three months while CPI was accelerating. Gold reacts to real interest rates, dollar strength, and central-bank flows as much as it reacts to inflation. Year-end bank targets for 2026 diverge sharply: Goldman $5,400, UBS $5,600, UBP $6,000, JPMorgan $6,300, with JPMorgan's Q4 2026 average forecast at $5,055/oz. What that range of targets tells you is that even the institutional desks don't agree on the path; treat gold as a 5%–10% portfolio sleeve with a 5–10 year holding period, not a tactical inflation trade.
Broad commodities. Commodity ETFs like DBC and PDBC hold a basket of front-month futures across energy, metals, and agriculture. Two structural costs reduce their net hedge value: roll yield drag when the futures curve is in contango, and expense ratios meaningfully higher than core TIPS ETFs. Commodities are a high-volatility inflation hedge — typically 10–15x more volatile than CPI itself — and tend to overshoot in both directions. The best use case is as a small (5%) tactical sleeve sized to provide protection against an energy-driven cost-push, not as a substitute for TIPS or I-bonds in a core hedge allocation.
Sector Tilts for a Stagflationary Tape
If the regime call leans stagflationary, sector composition starts mattering more than asset-class composition. The instruments that have historically held up are the ones with pricing power, inelastic demand, and operating cash flows that compress more slowly than nominal GDP. Translated into the 2026 ETF menu:
- Energy (XLE): Direct beneficiary of cost-push inflation; cash flows reset with commodity prices.
- Consumer staples (XLP): Inelastic demand for the goods households cannot postpone (food, household products); margin compression matters more than top-line.
- Healthcare (XLV): Demographic demand independent of growth cycle; pricing power varies sub-sector.
- Dividend aristocrats / value (SCHD, VYM): Consistent payout growth and shorter-duration cash flows discount less harshly in a higher-rate environment than long-duration growth equities.
- Value over growth: The relative-performance regime in high-inflation periods has historically favored shorter-duration earnings; growth equities pay more in valuation terms when the discount rate is higher.
What this set of tilts does not solve is the direction of the stagflation call. If growth surprises to the upside and inflation moderates, defensive sectors and value give up relative performance to growth and cyclicals. The asymmetric way to size these positions is small enough that being wrong on the regime call does not break the portfolio, large enough that being right meaningfully changes its risk profile.
Related Article: Red vs. Blue: The Battle of Colors in Investment Marketing
Inflation Planning for Retirement
The retirement angle is where inflation hedging stops being theoretical and starts mapping to monthly cash-flow math. Two mechanics matter more than the rest:
The TIPS ladder. A laddered portfolio of individual TIPS — equal-weighted face value maturing in each of the next 20 years — delivers a real cash flow that is mechanically inflation-adjusted, independent of secondary-market mark-to-market noise. The trade-off is liquidity (you are holding to maturity in each rung) and the phantom-income tax issue, which means a TIPS ladder belongs in an IRA, not a taxable brokerage.
The I-bond accumulation strategy. For pre-retirees, the $10,000/year purchase cap means a 10-year accumulation horizon builds a $100,000+ inflation-protected sleeve (plus accrued composite interest), redeemable starting at the 12-month mark. Used as the safe end of a retirement bucket strategy — emergency-fund-plus or year-one-of-retirement income — I-bonds outperform anything else available to retail at the same credit risk.
Inflation-adjusted safe withdrawal rate. The classic 4% rule was calibrated on historical inflation that averaged around 3%. In a regime where 1Q 2026 monthly inflation runs at 0.4%, the inflation-adjustment line of the SWR calculation is doing more work than usual; a retiree drawing on a fixed-rate-bond-heavy portfolio without TIPS or I-bond exposure is taking a real-purchasing-power risk that the historical 4% backtest did not fully price. The conservative move under regime uncertainty is to start at 3.5% rather than 4%, or to size a meaningful share of the bond sleeve in TIPS so that the inflation adjustment is mechanical rather than discretionary.
The Fed in 2026: Paused and Divided
The Federal Reserve held the federal funds target range at 3.50%–3.75% for the third consecutive meeting at its April 28–29, 2026 FOMC meeting, with a four-way dissent — the most divided FOMC vote since October 1992. Governor Miran wanted a cut; Hammack, Kashkari, and Logan opposed an easing bias. The market-implied path is now a hold through year-end, although Goldman Sachs Research projects two cuts later in 2026 toward a 3.00%–3.25% range.
What this means for inflation-hedge positioning: the duration call is genuinely uncertain. A longer-duration TIPS position (SCHP, TIP) earns more carry but loses if real yields rise; a shorter-duration position (VTIP) sacrifices carry for lower rate risk. The split FOMC vote is the market's way of telling you that institutional opinion is divided enough that betting hard on either path is a thesis trade, not an allocation decision. The diversified-duration answer — split the TIPS exposure between short and intermediate, keep some powder dry — is the unglamorous but defensible move.
What Would Change My View
The thesis underneath this entire framework rests on three claims: that the March 2026 CPI re-acceleration is at least partly durable (energy-driven cost-push plus a softer labor market is a regime shift, not a base effect); that inflation hedges chosen for their distinct mechanics (TIPS for direct CPI tracking, I-bonds for capped retail access, real assets for indirect economy correlation, defensive sectors for stagflation positioning) cover more than one possible outcome; and that the right portfolio under regime uncertainty is one that survives multiple scenarios rather than betting on one.
What would change my view? One thing, specifically: two consecutive CPI prints under 2.5% year-over-year combined with the energy contribution falling back toward zero. A single month of cooler data is noise — the BLS report has been noisy in both directions for two years. Two consecutive months of decisive cooling would tell me the 1Q 2026 acceleration was an energy passthrough that has rolled off, not the leading edge of a stagflation regime, and the right hedge allocation would shift accordingly toward less defensive positioning and lower TIPS duration. I am watching the next two CPI prints — May 12 and June 11 — more closely than the equity market.
Until those numbers print, the diversified-hedge approach above looks like the right answer for the data we actually have, not the data we wish we had.
This article is for educational purposes only and is not individual financial advice. Inflation hedges have correlation that breaks down in specific regimes, tax treatment that varies by account type, and liquidity constraints that matter most precisely when you need cash. Consult a licensed financial advisor and read each fund's prospectus before allocating capital. Past performance and forward-looking forecasts are not guarantees of future returns.
Frequently Asked Questions
Headline CPI was 3.3% year-over-year in March 2026, up from 2.4% a year earlier, with energy prices contributing the largest swing (+12.5% YoY). The April 2026 reading is scheduled to be released on May 12, 2026.
I-bonds currently pay a 4.26% composite rate (0.90% fixed + 3.34% variable) but cap at $10,000 per SSN per year and have a 12-month lockup. TIPS (and TIPS ETFs like SCHP, VTIP, TIP) offer a higher real yield (~1.80%–2.10%) with no purchase cap and daily liquidity, but are taxed annually on phantom inflation accruals — better held in IRAs. Use I-bonds for the first $10k of inflation protection per year, TIPS for everything above that.
Stagflation is the combination of rising prices and stagnant or contracting growth — the playbook differs from pure inflation. Defensive sectors (energy, staples, healthcare), real assets (gold, commodities), value over growth, and TIPS tend to outperform; long-duration bonds and high-multiple growth stocks tend to underperform. Size positions that survive both regimes rather than betting on one.
Gold's inflation-hedge reputation is real but condition-dependent. It hit an all-time high of $5,589/oz in January 2026 but fell 18% to around $4,564 by May — proof that gold reacts to real interest rates and global risk as much as to inflation itself. Bank year-end 2026 targets range from $5,400 (Goldman) to $6,300 (JPMorgan). Treat gold as a 5%–10% portfolio sleeve, not a primary hedge.
For TIPS exposure: SCHP (0.05% expense ratio, intermediate duration), VTIP (0.07%, short duration — faster reaction to inflation surprises), TIP (0.20%, long-standing benchmark). For real estate: VNQ (~3.5% yield) or REZ (residential/storage focus). For commodities: PDBC or DBC, with the caveat that broad commodity baskets are 10–15x more volatile than inflation itself.
No — at the April 29, 2026 FOMC meeting the Fed held the federal funds target range at 3.50%–3.75% for a third consecutive meeting, with four officials dissenting (the most divided vote since 1992). Markets imply the policy range likely holds through year-end, though Goldman Sachs Research projects two cuts later in 2026 toward a 3.00%–3.25% range.
REITs hedge inflation indirectly — landlords reset rents annually (residential, storage) or contractually (some commercial leases), so cash flows track CPI over time. VNQ yields ~3.5%–4% as of May 2026 and is positioned to benefit if the Fed resumes cutting later in 2026, but the sector lagged broad equities over the prior five years. Use REITs as a 5%–10% inflation/income sleeve, not a one-shot hedge.
A common framework: 10%–20% of the bond sleeve in TIPS (SCHP or VTIP), the first $10,000/year of new fixed-income allocation in I-bonds, 5%–10% in REITs (VNQ), and an optional 3%–5% in gold or broad commodities. The exact mix depends on age, time horizon, and whether the regime looks like pure inflation or stagflation.
Companies with pricing power and inelastic demand — energy (XLE), consumer staples (XLP), healthcare (XLV), and dividend aristocrats with consistent payout growth (SCHD, VYM). Value stocks historically outperform growth during high-inflation regimes because long-duration cash flows get discounted harder when rates are higher.