The Power of Dividend Investing: Building Passive Income Streams

The honest dividend investing 2026 question is not "which stock has the highest yield" — that question is marketing. The honest question is: over a five-to-ten year holding period, what does this position's combination of starting yield, dividend growth rate, payout ratio, and reinvestment produce in compounded per-share income, after tax, against a clear benchmark? That is the math the rest of this article is for. A 4% yield that grows at 8% per year and gets reinvested produces dramatically more 10-year cash flow than a 7% yield that does not grow and pays out 110% of earnings — and the difference between the two is the difference between dividend investing as a discipline and dividend investing as a yield-chasing trap.
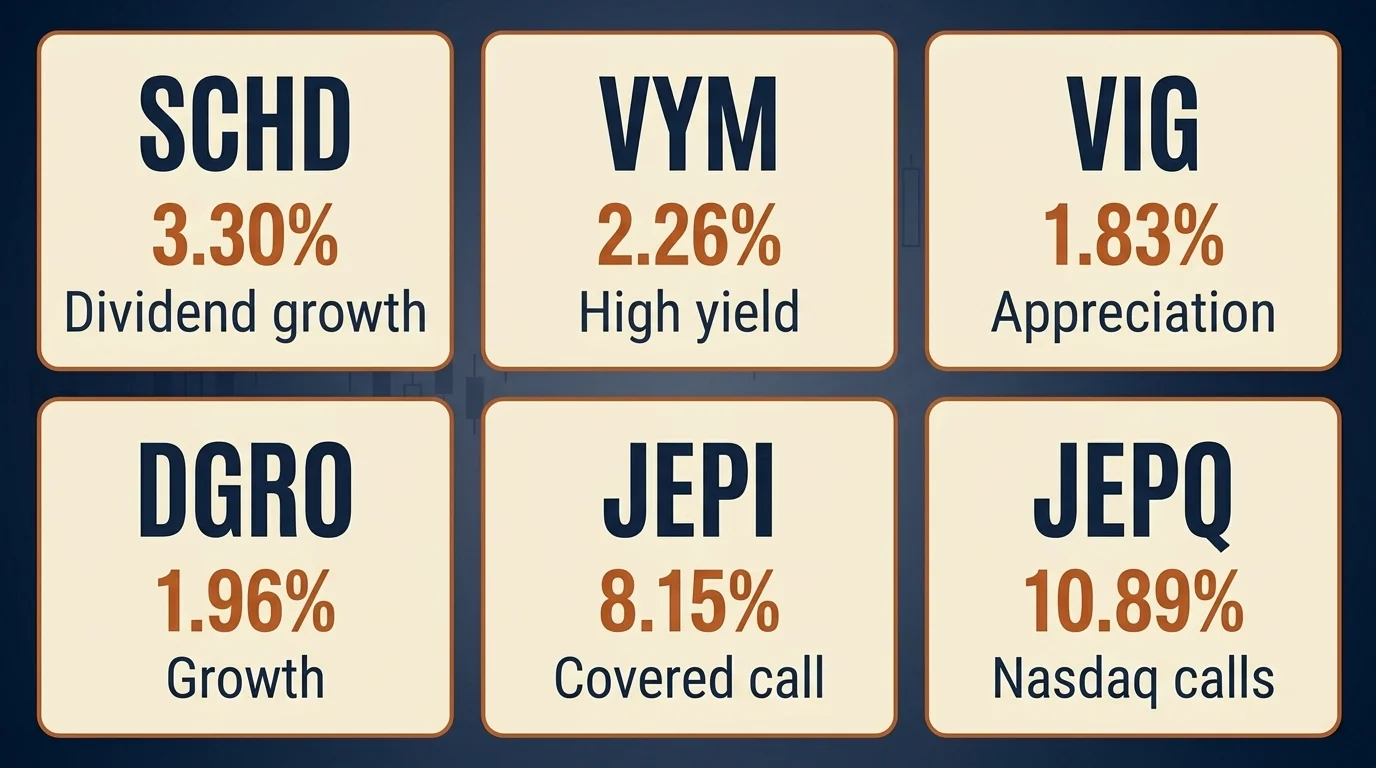
The major retail vehicles for executing the discipline are now mostly ETFs — SCHD with ~$84.8 billion in assets and a 3.30% yield; VYM with $88.7 billion and 2.26%; VIG and DGRO covering the dividend-growth angle; JEPI and JEPQ for high monthly distribution income at $44 billion and $34.3 billion respectively. The 2026 ETF comparison table later in this article is where most retail allocators actually need to start. Before that, the underlying math.
What a Dividend Is, and What the Yield Number Actually Means
A dividend is a portion of a corporation's after-tax earnings distributed to shareholders, typically quarterly in the US, in cash. The dividend yield is the metric most retail investors quote and the easiest to misuse.
Dividend yield = annual dividend per share / current share price. A stock paying $4.20 in annual dividends at $100/share has a 4.20% yield. That formula is correct and is also why a high yield can mean one of two very different things — either the company increased the dividend without the price catching up (good), or the price dropped without the company cutting the dividend yet (often bad). Yield in isolation does not tell you which.
Dividend payout ratio = dividends paid / earnings (EPS). This is the metric that distinguishes the two. Per NerdWallet's guidance, payout ratios above 80% are potentially concerning, and ratios near or above 100% indicate the company is paying more in dividends than it earns. Sustainable payout ratio ranges depend on industry: industrial and tech payers commonly run 30%–60%; mature utilities and consumer staples 60%–80%; REITs are required by their tax structure to distribute at least 90% of taxable income, so their payout-ratio math is different and needs to be evaluated on a funds-from-operations basis rather than EPS.
Coverage ratio = free cash flow / dividends paid. This is the metric a portfolio manager actually cares about, because earnings can be massaged and free cash flow is harder to fake. A coverage ratio above 1.5x is comfortable; below 1.0x means the dividend is being funded from somewhere other than operations (debt, asset sales, share issuance) and is structurally unsustainable.
The Yield Trap
A high yield without rising dividends and an acceptable payout ratio is almost always a price-collapse story, not a dividend-growth story. The classic pattern: the stock falls 40%, the dividend has not yet been cut, the trailing yield mechanically doubles, retail investors chase the yield, the dividend gets cut three quarters later, and the price falls again because the trailing yield support disappears. The defensive question every time you see a yield above the broad-market 2%–3% range is: did the yield rise because the dividend went up, or because the price went down? If the answer is the latter and the payout ratio is above 80%, the position is a yield trap until proven otherwise. Look at the five-year dividend growth rate and the payout ratio trend, not the headline yield.
How to Evaluate a Dividend Position
The disciplined evaluation moves through three layers in order, and the order matters.
- Is the dividend sustainable? Coverage ratio above 1.3x. Payout ratio in the normal range for the industry. Earnings stable or growing over the trailing five years. No debt-financed buyback or distribution.
- Is the dividend growing? Five-year dividend CAGR positive, ideally above 4%–6% for industrials and 8%+ for growth-tilted payers. Aristocrat status (25+ years) is a credibility signal, not a guarantee.
- Is the total return acceptable? Yield + dividend growth ≈ expected long-run total return for a slow-growth, stable payer. Add price appreciation only if there is a clear thesis for it. If the math does not get you to a reasonable benchmark-relative number, the position is income at the cost of compounding.
Most retail allocators are better served by skipping single-stock dividend selection and using one of the ETFs in the comparison table below — the underlying screen does the evaluation work, the diversification removes single-company default risk, and the expense ratios are now low enough that the math is competitive with self-managed portfolios.
The 2026 Dividend ETF Comparison: SCHD, VYM, VIG, DGRO, JEPI, JEPQ
The six funds below cover most of the practical dividend-ETF decision. Numbers as of early 2026; always verify current data in the prospectus before allocating.
| Ticker | Strategy | 12-mo yield | Expense ratio | AUM | Best for |
|---|---|---|---|---|---|
| SCHD | Dividend-growth (100 stocks, Dow Jones US Dividend 100 Index) | 3.30% | 0.06% | ~$84.8B | The default dividend-growth core; 10.6% 5-year dividend growth rate |
| VYM | High dividend yield (400+ stocks, FTSE High Dividend Yield Index) | 2.26% | 0.04% | ~$88.7B | Lowest cost, broadest diversification |
| VIG | Dividend appreciation (companies with 10+ year increase history) | 1.83% | 0.05% | ~$98B | Dividend-growth tilt, large-cap quality |
| DGRO | Dividend growth (iShares 5+ year increase screen) | 1.96% | 0.08% | ~$32B | Dividend growth at slightly lower starting yield; 13.01% 10-year annualized total return |
| JEPI | Covered-call equity income (S&P 500 + ELN overlay) | 8.15% | 0.35% | ~$44.0B | High monthly income; IRA-preferred placement |
| JEPQ | Covered-call equity income (Nasdaq 100 + ELN overlay) | 10.89% | 0.35% | ~$34.3B | High monthly income on tech-heavy index; IRA-preferred placement |
The cleanest mental model for using this table: SCHD is the default core for most retail dividend portfolios; VYM is the lower-cost broader alternative; VIG and DGRO are the dividend-growth tilts for investors who care more about rising income than current yield; JEPI and JEPQ are income-generation vehicles with structural trade-offs that need to be understood before use.
SCHD: The Default Dividend-Growth Pick
SCHD tracks the Dow Jones U.S. Dividend 100 Index — ~100 quality-screened stocks with 10+ year dividend history, ranked on cash flow / debt, return on equity, dividend yield, and 5-year dividend growth rate. The 0.06% expense ratio is essentially free. The 3.30% trailing yield is competitive with most dividend-tilted alternatives at materially higher quality. The 10.6% 5-year dividend growth rate is the number that separates SCHD from VYM at the math level: 3.30% starting yield growing at 10.6% per year produces, over a 10-year holding period, a yield-on-original-cost of roughly 9% — at which point the income compounds materially faster than a static 4% high-yield ETF.
For an investor building a core dividend allocation, SCHD is the default first position. The risk: SCHD's screen excludes most technology and most mega-cap growth names, so during a tech-led market rally it underperforms broad-market alternatives. If you want broader exposure with a similar dividend-quality tilt, pair it with VTI or VOO in the same account.
VYM, VIG, DGRO: The Vanguard / iShares Workhorses
VYM at 0.04% expense ratio is the cheapest dividend ETF on the menu and the broadest — 400+ stocks tilted toward high current yield with no growth screen. Better for an income-now allocation than a compounding allocation; the 2.26% yield is closer to the broad market and the dividend growth has lagged SCHD historically.
VIG is the dividend-appreciation pick — it screens for companies with 10+ consecutive years of dividend increases, weighted toward large-cap quality. Lower starting yield (1.83%) than SCHD or VYM, but stronger price-appreciation history because the screen overlaps meaningfully with the broad-market quality factor.
DGRO sits between SCHD and VIG — iShares' 5+ year dividend-increase screen with 445 holdings, a 1.96% trailing yield, and a 9.2% 5-year dividend growth rate plus a 13.01% 10-year annualized total return. Comparable quality screen to SCHD, slightly broader coverage, slightly lower starting yield. For an investor who wants two complementary positions, SCHD + DGRO is a defensible pair; SCHD + VYM is a defensible pair on different grounds (quality + diversification).
JEPI and JEPQ: What to Know Before You Buy
JEPI and JEPQ are not pure dividend ETFs — they are covered-call income strategies. The mechanic: the fund holds an underlying equity portfolio (S&P 500 for JEPI, Nasdaq 100 for JEPQ) and sells equity-linked notes (ELNs) that capture call premium income, which is distributed to shareholders monthly. The high distribution yields (JEPI 8.15%, JEPQ 10.89%) come from the option premium, not from underlying company dividends.
Two structural trade-offs make these funds different from SCHD/VYM/VIG/DGRO:
- Capped upside in bull markets. Over the past year, JEPI returned 10.5% on a price basis while SPY returned 20.1% — that ~10-point gap is the structural cost of the covered-call overlay in a rising market. JEPQ has held NAV better (+11% since inception) than JEPI (-3% since inception), but the cap-on-upside trade-off applies to both.
- Distributions are taxed as ordinary income, not qualified. Because the ELNs source premium income rather than dividends, the bulk of JEPI and JEPQ distributions do not meet the qualified-dividend holding-period rules — they are taxed at your marginal ordinary-income rate, not the lower long-term capital-gains rate that qualified dividends receive. This makes them tax-inefficient in taxable brokerage accounts and best held in IRAs or 401(k)s.
The honest framing: JEPI and JEPQ are useful for investors who specifically need monthly cash distributions and can hold them in a tax-advantaged account. They are not a substitute for SCHD/VYM/VIG/DGRO as a long-term compounding position, because the covered-call mechanic structurally caps total return below what a comparable un-overlaid equity position produces. They are an income tool, not a wealth-building tool.
DRIP: A Worked Compounding Example
Dividend reinvestment is the mechanic that converts a moderate yield into significant compounding income over a long holding period. The math is mechanical, but the result is non-obvious.
Worked example: $10,000 in SCHD at the current 3.30% starting yield, with 10.6% annual dividend growth (the trailing 5-year rate), and all dividends reinvested at the year-end share price. For simplicity, hold the share price constant — the example isolates the compounding effect of dividend growth + reinvestment, separate from price appreciation.
| Year | Annual dividend $ | Reinvested shares (cumulative) | Year-end income |
|---|---|---|---|
| 1 | $330 | +3.30% shares | $341 |
| 5 | $493 (33% above year 1) | +18% shares | $584 |
| 10 | $828 (151% above year 1) | +37% shares | $1,134 |
| 15 | $1,390 | +58% shares | $2,197 |
| 20 | $2,335 | +83% shares | $4,275 |
The year-20 annual income of $4,275 on the original $10,000 is a 42.75% yield-on-original-cost. The same $10,000 taking dividends in cash (no reinvestment) would generate $2,335 in year 20 — still substantial, but with the position size never growing. Over a 20-year horizon, DRIP roughly doubles the terminal income from the same starting capital.
This is the actual case for dividend reinvestment, and it is why the highest CPC in the entire dividend keyword cluster ($22.41) sits on the term "dividend reinvestment" — the brokerages that win this query at a high cost-per-click win an account-opening event with multi-decade compounding value. The math works for them; it works the same way for you.
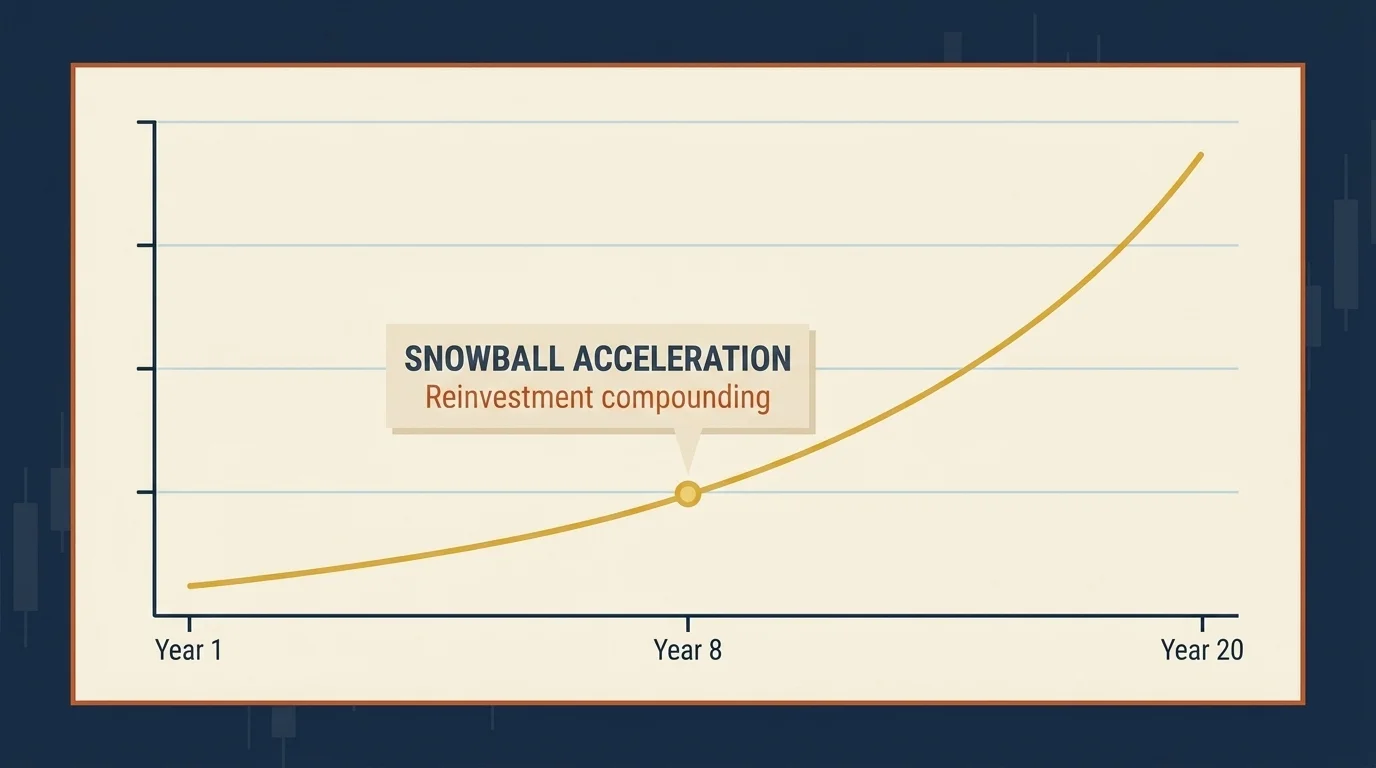
The Dividend Snowball
The dividend-snowball framing — popularized on Reddit and FinTok — is the same math applied to ongoing contributions instead of a lump sum. Worked example: $500/month into SCHD at 3.30% starting yield, 10.6% dividend growth, full DRIP, over 20 years, share price constant for the math.
Annual cash dividend, by year (assumes contributions continue through year 20):
- Year 1: ~$100 in annual income
- Year 5: ~$750
- Year 10: ~$2,800
- Year 15: ~$8,200
- Year 20: ~$21,000
The non-linearity of the curve is the snowball. Around year 7–8, the position grows large enough that dividends alone start buying a meaningful number of additional shares each quarter without further contributions; the income acceleration after that compounds against itself. The honest caveat: this math assumes the dividend growth rate holds. SCHD's 10.6% historical growth rate could persist or could compress; the snowball is more powerful in the persistence scenario and meaningfully smaller in the compression scenario. The disciplined investor sizes for the middle case (6%–8% growth) and treats the upside scenario as a tail.
How Are Dividends Taxed in 2026
US dividend taxation runs along two tracks: qualified dividends (taxed at the lower long-term capital-gains rates) and ordinary (non-qualified) dividends (taxed at your marginal ordinary-income rate). The distinction matters enough to drive account-location decisions.
Qualified dividend brackets for 2026:
| Filing status | 0% rate up to | 15% rate up to | 20% rate above |
|---|---|---|---|
| Single | $49,450 | $533,400 | $533,400 |
| Married Filing Jointly | $98,900 | $600,050 | $600,050 |
| Head of Household | $66,700 | $556,700 | $556,700 |
On top of the qualified-dividend rate, the Net Investment Income Tax adds 3.8% on investment income (including dividends) above $200,000 single / $250,000 married filing jointly in modified adjusted gross income. The top combined marginal rate on qualified dividends is therefore 23.8%.
To qualify for these lower rates, dividends must come from US corporations or qualified foreign corporations, and the investor must hold the share for more than 60 days within the 121-day window that begins 60 days before the ex-dividend date. Most retail dividend ETFs (SCHD, VYM, VIG, DGRO) produce primarily qualified distributions because the holdings and holding periods naturally meet the rules. JEPI and JEPQ produce primarily non-qualified distributions because the income comes from ELN premium, not underlying equity dividends — that is the structural tax inefficiency that drives the IRA-placement guidance below.
Related Article: Sustainable Investing: Aligning Values with Financial Goals
Account Location: Where Each Dividend ETF Belongs
The interaction of the tax brackets above with the ETF mix is the most-overlooked optimization in retail dividend investing. The rough decision framework:
- JEPI, JEPQ, and similar covered-call income ETFs: hold in an IRA or 401(k). The ordinary-income tax treatment makes them materially less efficient in a taxable account, and the tax-deferred wrapper preserves the high distribution rate.
- SCHD, VYM, VIG, DGRO, and qualified-dividend ETFs: acceptable in either a taxable account or an IRA. The qualified-dividend rate is already favorable, and the long holding-period nature of these positions makes them tax-efficient in a taxable brokerage.
- REITs and REIT ETFs (VNQ, IYR): hold in an IRA when possible. REIT distributions are taxed as ordinary income (with a partial qualified-business-income deduction), so the tax-deferred wrapper preserves the yield.
- International dividend ETFs (VYMI, SCHY): usually fine in a taxable account; you can claim a foreign tax credit on foreign withholding tax that is partially refunded at the individual return level. This benefit is lost in an IRA.
The total dollar magnitude of account-location optimization for a typical retail dividend portfolio is real but not the dominant decision — fund selection matters more than location, and consistent contribution matters more than either. But for an investor running $250k+ in dividend exposure with mixed-tax-treatment ETFs, the after-tax compounding difference from getting the location right is worth several thousand dollars per year over a multi-decade horizon.
Dividend Aristocrats and Dividend Kings
The two retail-investor labels for "companies that have been paying and raising dividends for a long time" are not synonyms.
Dividend Aristocrats: S&P 500 members with 25+ consecutive years of dividend increases. The 2026 count is a record 69 members — up from 66 in 2024, with three additions in 2025: FactSet (FDS), Erie Indemnity (ERIE), and Eversource Energy (ES).
Dividend Kings: any US company with 50+ consecutive years of dividend increases, regardless of index membership. The 2026 count is approximately 56 companies.
The credibility signal in both lists is straightforward: maintaining a dividend through multiple recessions, oil shocks, and credit cycles requires either genuinely durable cash-generation economics or genuine management commitment to the dividend as a capital-allocation discipline. Neither is a guarantee — a 25-year aristocrat that cuts the dividend tomorrow has the same forward economics as any other dividend cutter — but the historical record is a meaningful prior.
Top-yielding 2026 aristocrats: Amcor (AMCR) 6.6%, T. Rowe Price (TROW) 5.2%, Kimberly-Clark (KMB) 5.2%, Realty Income (O) 5.1%, Clorox (CLX) 5.1%. The high yields are themselves a signal — the market is pricing some skepticism about whether the dividend growth continues at the historical rate, and the disciplined investor reads the most recent annual report before assuming a 5%-plus yielder is in the same operating position it was five years ago.
Sector concentration in the 2026 aristocrat list: over 50% of the 69 members sit in consumer staples, industrials, healthcare, and utilities; only two technology names (IBM, Roper); zero in communications. The composition reflects that consistent multi-decade dividend growth is mechanically easier in industries with stable cash generation, recurring revenue, and modest capital intensity. It also means a portfolio built purely from aristocrats is structurally concentrated in defensive sectors — fine if that is the goal, suboptimal if the goal is broad market exposure with a quality tilt.
Monthly Dividend Pay Calendar
Most US dividend payers distribute quarterly. The exceptions are a small set of monthly-paying stocks and ETFs that exist specifically to smooth investor cash flow. The reference name in the category is Realty Income (O), which has paid 670 consecutive monthly dividends, increased the dividend 134 times, and raised it annually for over 30 years. Other established monthly payers: Main Street Capital (MAIN), STAG Industrial (STAG), and Agree Realty (ADC).
On the ETF side, JEPI, JEPQ, and SPYI all distribute monthly. SCHD, VYM, VIG, and DGRO distribute quarterly (typically March / June / September / December). The cash-flow smoothing argument for monthly distributions is mostly psychological for accumulation-phase investors and meaningful for retirees living off portfolio income — for the latter, monthly distribution simplifies the alignment between portfolio cash and recurring expenses without needing to maintain a separate cash buffer.
Building a Dividend Portfolio: The Allocation Math
The "how much do I need to live off dividends" question has a clean answer that depends almost entirely on the yield assumption and the inflation-protection assumption.
| Target annual income | At 3.30% yield (SCHD) | At 4.0% yield (SCHD + VYM mix) | At 8.15% yield (JEPI in IRA) |
|---|---|---|---|
| $25,000 | $760,000 | $625,000 | $307,000 |
| $50,000 | $1,520,000 | $1,250,000 | $613,000 |
| $75,000 | $2,275,000 | $1,875,000 | $920,000 |
| $100,000 | $3,030,000 | $2,500,000 | $1,225,000 |
The right column is misleading: $1.225M at 8.15% produces $100k of current income, but the JEPI distribution does not grow with inflation, and the covered-call mechanic structurally caps total return below an un-overlaid equity exposure. Over a 20-year retirement, the inflation-adjusted purchasing power of $100k of JEPI income compresses meaningfully; the same $100k from a SCHD-equivalent dividend-growth portfolio rises with the dividend growth rate. The honest framing for a retirement income allocation is to size from the real yield (yield + dividend growth - inflation), not the headline distribution rate.
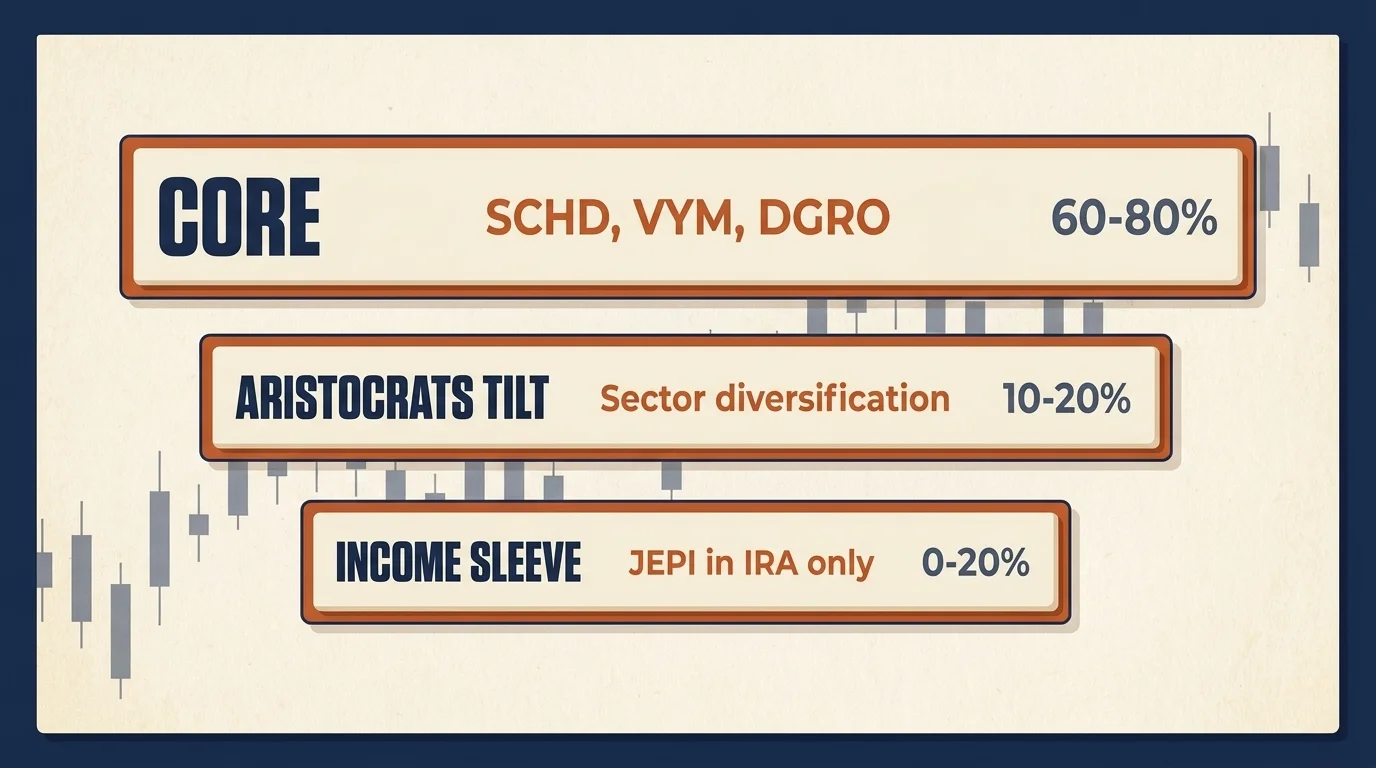
For a typical retail allocator building toward financial independence, the disciplined construction is some combination of: a SCHD/VYM/DGRO core (60%–80% of the dividend sleeve, for compounding and inflation protection), an optional aristocrats-tilt position for sector diversification (10%–20%), and an optional JEPI/JEPQ income sleeve in tax-advantaged accounts for those who specifically need higher current cash flow (0%–20%). Rebalance annually; reinvest dividends until you actually need them as cash; track the year-over-year dividend dollars, not the share price.
Related Article: Impact of Inflation on Investment Strategies
What Would Change My View
The thesis underneath this article is that disciplined dividend investing — focused on payout-ratio-supported, growth-capable distributions in low-cost ETFs, with reinvestment until the cash flow is actually needed — produces a competitive after-tax total return for a retail investor over a 10-to-20-year horizon. The honest comparison benchmark is a total-market index fund (VTI at 0.03% expense ratio, S&P-broad exposure) plus the option to harvest gains as needed. Dividend ETFs trade a small expected-return drag for the behavioral discipline of consistent cash flow and the structural quality tilt of the underlying screens.
What would change my view? One thing, specifically: the 5-year dividend growth rate on SCHD (currently 10.6%) compressing below 4% for two consecutive five-year windows, and the trailing yield not rising to compensate. That combination would tell me the underlying screen has stopped producing the dividend-growth premium that justifies holding the strategy over a low-cost broad-market alternative. I am watching the year-over-year SCHD distribution growth and the SCHD-vs-VTI total-return gap on a 5-year rolling basis. Until that data shifts, the math reads as a defensible case for a 20%–40% allocation in the dividend ETF sleeve for an investor with a 10-year-plus horizon.
The discipline that matters more than the strategy choice: consistent contribution, automatic reinvestment, annual rebalance, and the patience to let the dividend-growth math compound for the multi-decade period it actually needs.
This article is for educational purposes only and is not individual financial advice. Dividend yields, expense ratios, fund holdings, and tax brackets change frequently; always verify current data from each fund's prospectus and the IRS before allocating capital. Consult a licensed financial advisor and a tax professional for guidance matched to your specific situation. Past performance and historical dividend-growth rates are not guarantees of future returns.
Frequently Asked Questions
Dividend yield = annual dividend per share / current share price. A stock paying $4.20 in annual dividends at $100/share has a 4.20% yield. Yields above 6–7% on common stocks warrant a payout-ratio check — yield can be high because the dividend grew or because the price collapsed.
Qualified dividends are taxed at long-term capital-gains rates: 0% for single filers with taxable income up to $49,450 (MFJ $98,900), 15% from there to $533,400 single ($600,050 MFJ), and 20% above. Non-qualified dividends are taxed as ordinary income. The 3.8% Net Investment Income Tax applies above $200,000 single / $250,000 MFJ (modified AGI). Top combined marginal rate on qualified dividends: 23.8%.
Qualified dividends meet IRS holding-period rules (typically more than 60 days within the 121-day window beginning 60 days before the ex-dividend date) and come from US corporations or qualified foreign corporations — they get the lower LTCG rates. Ordinary (non-qualified) dividends — including most REIT distributions and JEPI/JEPQ covered-call income — are taxed at your marginal ordinary-income rate.
SCHD (3.30% yield, 0.06% expense, ~100 holdings, 10.6% 5-year dividend growth) is the dividend-growth pick — fewer, higher-quality names with stronger growth. VYM (2.26% yield, 0.04% expense, 400+ holdings, $88.7B AUM) is the broad-diversification, lowest-cost pick. SCHD historically delivers stronger income growth; VYM delivers wider exposure.
Both are structurally designed for income, not total return. JEPI yields 8.15% and JEPQ 10.89% (2026), but distributions are mostly taxed as ordinary income because they come from equity-linked notes — best held in an IRA/401(k). In a strong bull market, the covered-call overlay caps upside: JEPI returned 10.5% on price over the past year vs SPY's 20.1%. JEPQ's NAV has held up better (~+11% since inception) than JEPI's (~-3%).
Dividend Aristocrats are S&P 500 members with 25+ consecutive years of dividend increases — 69 in 2026 (up from 66 in 2024, with 2025 additions FactSet, Erie Indemnity, and Eversource Energy). Dividend Kings have 50+ consecutive years of increases regardless of index membership — approximately 56 in 2026. Top-yielding aristocrats: Amcor 6.6%, T. Rowe Price 5.2%, Kimberly-Clark 5.2%, Realty Income 5.1%, Clorox 5.1%.
At a 4% portfolio yield, $1M produces $40,000/yr pre-tax; $25,000/yr requires ~$625,000. At SCHD's 3.30% yield, $1M produces $33,000/yr; a $50,000/yr target needs ~$1.5M. At JEPI's 8.15%, $500,000 produces $40,750/yr — but distributions are ordinary income, so factor your marginal tax rate. Sustainable retirement income requires dividend growth at or above inflation.
The dividend snowball is a strategy of consistently contributing capital and reinvesting all dividends to compound growth. Example: $500/month into SCHD at 3.30% starting yield and 10.6% historical dividend growth compounds dramatically over 20 years — both share count and per-share dividend rise, so annual income accelerates non-linearly. The 'snowball' describes the year-over-year acceleration once the position grows large enough that dividends alone buy meaningful additional shares each quarter.
The ex-dividend date is the cutoff: buy a stock before the ex-date and you get the next dividend; buy on or after it and the seller keeps the dividend. To qualify for the lower qualified-dividend tax rate, US investors must hold the share for more than 60 days within the 121-day window that begins 60 days before the ex-dividend date.
The payout ratio = dividends paid / earnings (EPS). Industrial and tech payers typically run 30–60% (room to grow); mature utilities and consumer staples often run 60–80%; REITs are required to distribute at least 90% of taxable income so their payout-ratio math differs. A payout ratio above 80% deserves scrutiny; above 100% (paying more in dividends than the company earns) is a red flag for dividend sustainability.
Check Out These Related Articles

Securing Financial Health: Safeguarding Consumer Interests in Investment Products

Finance Mentor vs Sponsor: What Actually Compounds a Career

Youth-Led Financial Revolutions: Crowdsourcing as a Catalyst for Investment Innovation