The Art of Behavioral Finance: Decoding Investor Psychology and Decision-Making


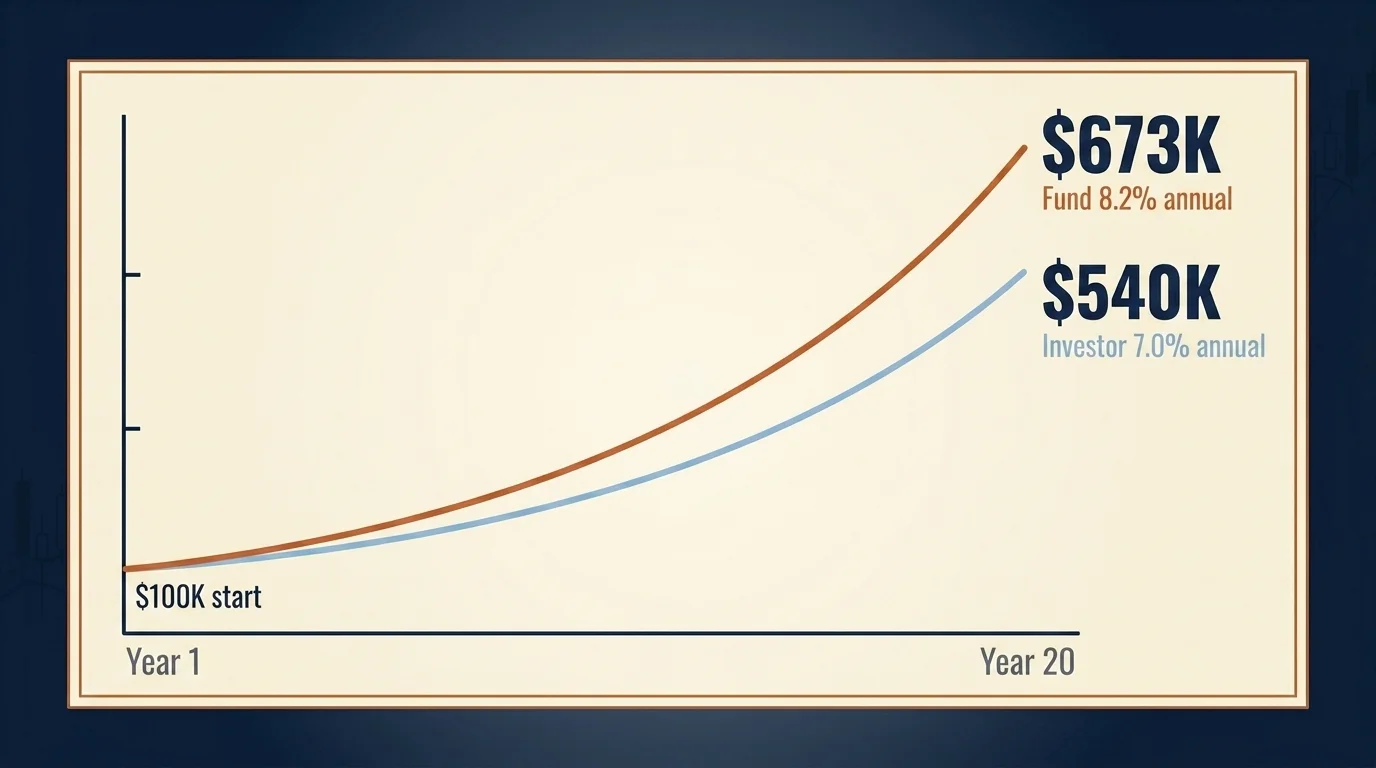
The number worth opening this article with is not a market level or a portfolio recommendation. It is the 1.2 percentage points per year that the average dollar invested in US stock funds and ETFs earned less than the funds themselves over the decade ending December 31, 2024, per Morningstar's 2025 Mind the Gap study. The funds returned 8.2% annually; the average dollar invested in them returned 7.0%. The gap is what investor psychology costs in basis points. Compounded over 20 years on a $100,000 starting position at 8.2% versus 7.0%, the closing balance is approximately $540,000 instead of $673,000 — a $133,000 cost to behavior, on the same capital, in the same funds.
What this article is for is the practical question that follows from that number: which specific biases produce that gap, what does each one look like in the moment, and what is the disciplined practice that interrupts it before the trade gets placed. The companion piece Behavioral Finance: 10 Investor Biases (with 2024–2025 Data) is the theoretical hub — it covers the field's foundational structure, the academic lineage from Kahneman and Tversky through Thaler and Shiller, and the bias library at definitional depth. This piece is the practitioner field guide — the version you reach for at the moment when you are about to make a trade and need a structured way to talk yourself out of doing it for the wrong reason.
The 1.2% Behavior Gap
The Morningstar number is the right anchor because it is large enough to matter, small enough to be plausible, and structurally honest about what investor psychology actually does to long-run returns. Sector equity funds suffer the largest gap, at roughly 1.5% per year; allocation and alternative funds the smallest, at about 0.1%. The pattern that produces the gap is consistent across categories: investors buy after gains, sell after losses, concentrate in the names that have been working, and abandon them in the drawdowns that follow. None of those decisions is malicious; most are well-intentioned. They are also measurable, repeatable, and expensive.
What this gap does not tell you is the path. A 1.2 percentage point average drag conceals years when the average investor matched their funds and years when they trailed by 4 percentage points or more. The mechanism is asymmetric: most years are quiet, and the cumulative cost shows up during a few high-volatility windows when emotional decisions cluster. The disciplined response is not to "be more rational" — that instruction has zero leverage. The disciplined response is to install structural friction between System 1 (the fast, emotional, pattern-matching brain that wants to act) and System 2 (the slow, deliberate brain that can run a 10-K analysis but routinely loses the race to System 1 in stress events).
Kahneman's System 1 and 2: Why Bias Is Structural, Not a Character Flaw
Daniel Kahneman won the 2002 Nobel Memorial Prize in Economic Sciences for integrating psychology into economics — specifically for the work on heuristics, biases, and Prospect Theory that he developed with Amos Tversky beginning in the 1970s. His 2011 book Thinking, Fast and Slow is the canonical introduction. The two-system framing matters here because it reframes "bias" from a personal failure (which is what most retail investors hear) into a structural feature of how the brain processes decisions under uncertainty.
System 1 is fast, automatic, and pattern-matching. It tells you the market "feels overheated" before you have looked at any data; it tells you to sell when the screen turns red because the loss is salient. System 2 is slow, deliberate, and effortful. It reads the 10-K, runs the cash-flow model, and asks whether the position's drawdown actually invalidates the thesis.
Every bias in the catalogue below is structurally an instance of System 1 generating a fast answer that System 2 fails to interrogate before action is taken. The point of the disciplined practice this article describes is not to silence System 1 — that is impossible. The point is to install friction that forces a System 2 evaluation before the order executes. That friction is most of what behavioral coaching, written investment policy statements, and pre-trade checklists actually do. They are not magic. They are mechanical devices that buy System 2 the time it needs to win.
Your Phone Is the Bias Amplifier
The structural difference between behavioral finance in 2026 and behavioral finance ten years ago is that the bias amplification mechanisms now live inside the trading apps themselves. The mechanism is not subtle, and the research is converging.
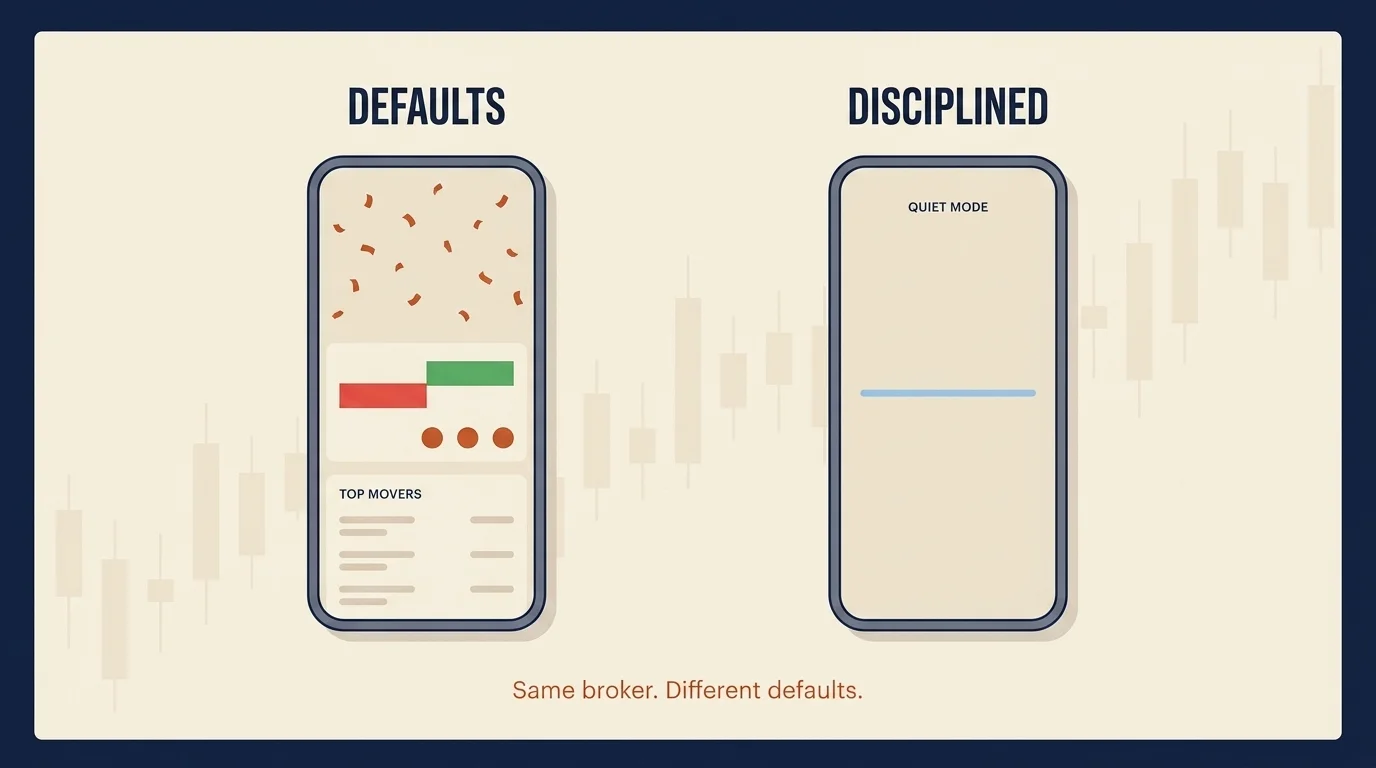
A 2024 study in the Journal of Behavioral Finance found that Robinhood users trade more on news and PR spikes than peers on other brokerages, with measurably worse risk-adjusted returns. The app's UX — the push notifications, the "Top Movers" feed, the absence of friction between price spike and order placement — is itself a recency-bias amplifier built into the default user flow.
A 2024 paper in Management Science on trading gamification found that gamified UI elements (confetti animations, badges, streaks) contributed to a measurable +5.17% increase in trading volume. The 2025 retail-options data from LSU is starker: 0DTE (zero-days-to-expiration) option trades lose 4.7% on average relative to other option trades, versus +0.19% for non-0DTE option trades. Roughly 9.5% of retail investors now exhibit trading patterns consistent with gambling-disorder profiles.
The content layer is doing the same thing. The average US "FinTok" (TikTok finance content) user logged 416 hours of finance video in 2025; the millennial cohort averaged closer to 520 hours per year. DayTrading.com's April 2026 audit of viral investing TikToks found that 75% scored C or worse on accuracy and risk disclosure, 60% scored F on disclosures, and 0% earned an A on accuracy. The algorithm rewards urgency and confidence — exactly the two emotional triggers that drive FOMO and overconfidence biases.
The practical implication for the disciplined retail investor: the trading environment you operate in is engineered to amplify the biases that produce the behavior gap. The defensive response is to engineer your own environment for the opposite outcome:
- Push notifications off. Every market alert is a System 1 prompt; you do not need them.
- Watchlist auto-refresh disabled. Watch the chart manually on a schedule, not when the app pings you.
- P&L display hidden or summarized only. The minute-by-minute green-and-red color is a loss-aversion driver, not a signal.
- Order confirmation friction added. Most brokers allow you to require a confirmation step or a typed thesis before placing an order. Use it.
- A 24-hour cooling-off period before any unplanned trade larger than 1% of portfolio. Most impulses do not survive twenty-four hours; most analyses do.
None of this requires willpower. All of it requires one weekend's worth of settings changes and the discipline not to undo them when the market gets exciting.
The 4-Question Pre-Trade Gut Check
The single most useful piece of behavioral infrastructure I have used, both in professional practice and in my own portfolio, is a written four-question pre-trade gut check. The exact wording does not matter; what matters is that the questions are written down and that you actually answer them before any non-routine trade.
What would I do if this position were already cash? This is the cost-basis-free question. If the answer is "I would buy it at this price," holding is correct. If the answer is "I would not buy it at this price," holding is anchoring on cost basis. The reverse case is just as important: if you are considering selling a winner, ask whether you would buy the position today at today's price. If the answer is yes, the urge to "take profits" is disposition effect, not analysis.
Am I acting primarily on a price move from the last seven days? A position thesis built on multi-year fundamentals does not change in seven days. If the news that changed your mind is a price move, the position thesis was not what you thought it was — or the price move is recency bias talking. Either is a reason to pause.
Would I make this trade if I had to wait 24 hours? Most impulses do not survive a 24-hour cooling-off period. Most disciplined trades are unchanged by it. The 24-hour rule does almost no damage to genuine opportunities and disarms the majority of bias-driven trades.
What is my pre-written exit rule? Before placing the order, write down the specific condition under which you will sell. Not "if the price drops" — write down the fundamental condition (impairment of incremental ROIC, thesis-breaking earnings miss, management change, regulatory event). If you cannot articulate the exit condition before the entry, you do not have a complete trade plan, and the trade is more bias-driven than analytical.
The four questions are not a magic formula. They are a System 2 forcing function. Most professional traders I worked with at the broker-dealer ran an informal version of this in their heads before placing a trade; the formalized written version exists because retail investors do not have the trading-floor culture that disciplines the same behavior, and the written form is the substitute.
Related Article: Finance Mentor vs Sponsor: What Actually Compounds a Career
9 Biases That Cost Real Money
The biases below are the ones that produce the largest share of the documented behavior gap, with definition, a 2024–2026 retail example, and the specific counter-tactic that disarms each. For deeper theoretical context, see the companion bias-library article.
Recency Bias
Definition. Over-weighting recent events when forming forward expectations.
2024–2026 example. Investors who bought technology heavily in late 2024 because technology had been the dominant return generator in 2024 — and were then hit by the early-2025 drawdown — were acting on recency bias.
Counter-tactic. Reference 10-year average returns, not 90-day chart performance, when making allocation decisions. Mechanical rebalancing on a schedule forces selling of recent winners and buying of recent losers, which is exactly the trade recency bias resists.
Related Article: Youth-Led Financial Revolutions: Crowdsourcing as a Catalyst for Investment Innovation
Anchoring Bias
Definition. Over-weighting the first numerical reference point — usually your cost basis — when evaluating a current position.
2024–2026 example. Refusing to sell a position because doing so would realize a loss versus your purchase price, even when the cost-basis-free analytical question would tell you to exit.
Counter-tactic. The first of the four pre-trade questions above: "What would I do if this position were already cash?" The cost basis is not on the question; the answer is independent of P&L.
Overconfidence Bias
Definition. Systematic overestimation of one's analytical ability or the precision of one's forecasts.
2024–2026 example. Retail 0DTE option trades lose 4.7% on average relative to other option trades, versus +0.19% for non-0DTE option trades. The 0DTE category is the clearest current expression of overconfidence — trading on a single-day move that almost no professional trader claims to predict reliably.
Counter-tactic. Track every trade in a journal with a written thesis and a calibrated probability before entry. The gap between your forecast and the realized outcome — measured over fifty trades — will humble the bias quickly. Most retail traders who keep an honest journal materially reduce trading frequency within a year.
Related Article: Red vs. Blue: The Battle of Colors in Investment Marketing
Loss Aversion
Definition. Losses hurt more than equivalent gains feel good — Kahneman and Tversky's original 1992 estimate put the asymmetry at roughly 2.25x, though more recent meta-analyses suggest the magnitude is closer to 1.3x–2x depending on stakes.
2024–2026 example. Holding a losing position past the point where the disciplined analysis would say to exit, because realizing the loss is more psychologically painful than the analytical math says it should be.
Counter-tactic. Pre-written kill criteria. Before opening the position, write down the specific conditions under which you will sell. When those conditions trigger, sell — independent of P&L. The pre-commitment moves the loss-realization decision out of the moment of pain.
Confirmation Bias
Definition. The tendency to seek information that supports an existing thesis while discounting contradicting evidence.
2024–2026 example. Increasing your position size in a holding after good news while explaining away three pieces of bad news as "noise" or "temporary."
Counter-tactic. The pre-mortem. Before initiating a position, write a one-page memo describing how this investment fails. Re-read the memo whenever you consider adding. The discipline forces contradicting evidence into your active consideration.
Herd Mentality
Definition. Following the crowd into or out of a position, especially during high-conviction collective moves.
2024–2026 example. Retail trading volume in 2025 hit roughly 60% above 2024 levels and approximately 17% above the 2021 meme-stock peak, with social-media-coordinated rallies on Reddit and X driving much of the activity. Most participants in the late-stage rallies are providing exit liquidity to earlier entrants.
Counter-tactic. Write a one-sentence thesis before any non-routine trade. If you cannot articulate why the position works independent of crowd behavior, do not take it. The Investment Policy Statement formalizes this at the portfolio level.
Disposition Effect
Definition. Coined by Shefrin and Statman in 1985, the tendency to sell winning positions too early and hold losing positions too long — both driven by loss aversion.
2024–2026 example. Selling AAPL at +20% to "take profits" while simultaneously holding a worse-performing EV position at –60% because "I don't want to lock in the loss." The forward-return math is identical for both positions at their current prices.
Counter-tactic. Same as anchoring — the cost-basis-free question. Combined with quarterly tax-loss harvesting that converts disposition into a realized tax benefit, which structurally disarms the emotional cost.
Mental Accounting
Definition. Treating money differently based on its source or intended use, even though all money is fungible.
2024–2026 example. Investing a year-end bonus or tax refund more aggressively than the same dollar amount accumulated through payroll contributions. Or holding high-cost active funds in a taxable account while paying down low-rate debt — the spread is negative net of tax and fees, but the accounts feel separate.
Counter-tactic. A quarterly household net-worth statement that treats every dollar as fungible, regardless of which bucket it lives in.
FOMO and Panic Selling
Definition. Fear of missing out (buying because price is rising or others are buying) and panic selling (exiting because price is falling and others are exiting). Both are System 1 responses to salient social signals.
2024–2026 example. A 2024 Journal of Behavioral Finance paper found 68% of crypto investment decisions were driven primarily by FOMO rather than technical analysis. Panic selling shows up most clearly in the Morningstar gap data for sector funds (1.5% annual underperformance), where investors enter the sector after the rally and exit during the drawdown.
Counter-tactic. A written watchlist with pre-set entry criteria for buys, and an IPS-defined rebalancing rule for drawdowns. The 24-hour rule alone disarms most FOMO impulses. For panic selling, automated rebalancing means the discipline is not in your hands during the moment when your hands cannot be trusted.
Pre-Written Rules That Survive Contact With the Market
The structural insight underneath every counter-tactic above is that rules written before the situation are more reliable than judgment exercised during the situation. The disciplined investor's toolkit is essentially a set of pre-commitment devices.
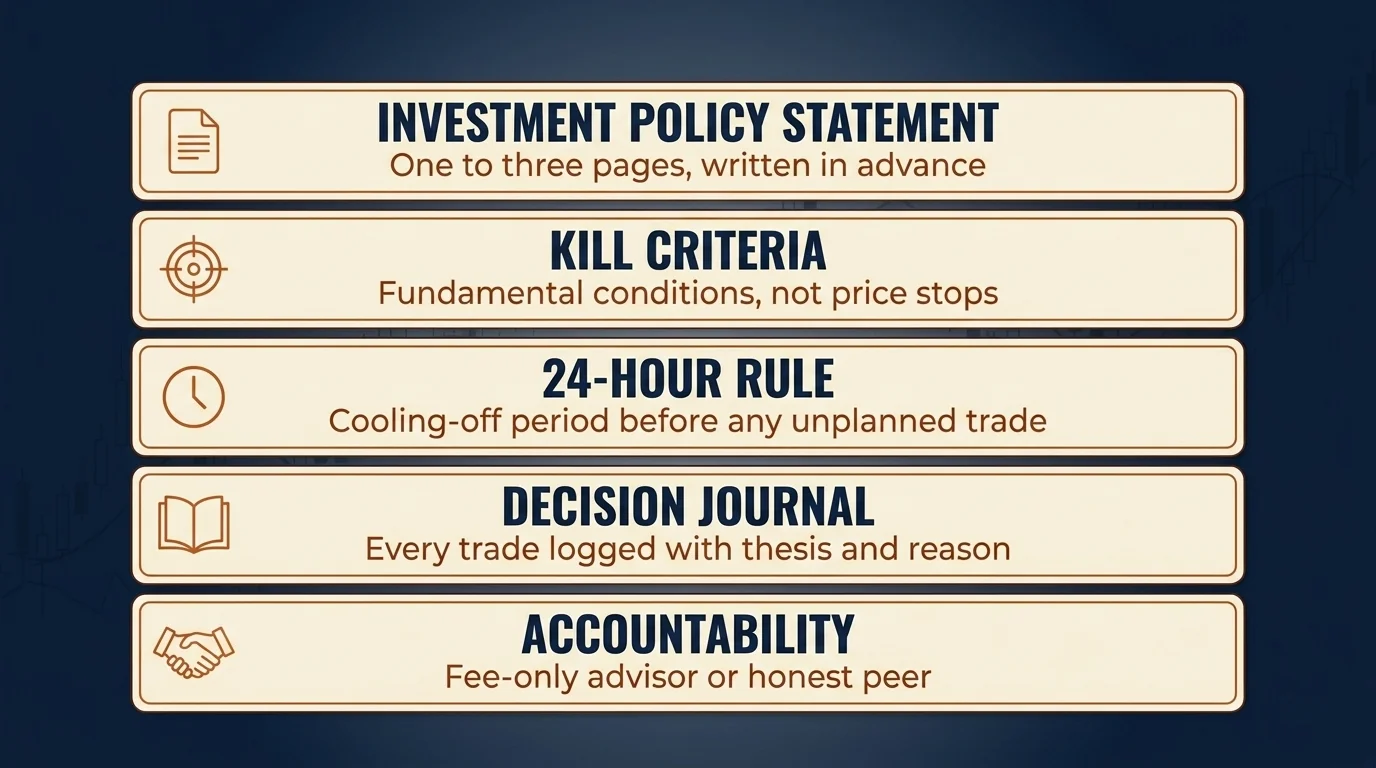
The Investment Policy Statement (IPS). A one- to three-page written document that specifies target allocation, rebalancing triggers, contribution schedule, withdrawal rules, and the conditions under which you will deviate from the plan. The IPS is the single most important behavioral guardrail an investor can build, and most retail investors do not have one. The reason institutional portfolios do better than retail in the long run is not that institutions have better information — it is that institutions cannot impulsively override the IPS at 3 p.m. on a bad market day. Build your own.
Kill criteria. For every position you hold, write down the specific condition under which you will exit. Not "if the price drops 15%" — write down the fundamental condition (thesis-breaking earnings miss, regulatory change, management departure, structural shift in the underlying business). The price stop-loss exists for risk management; the fundamental kill criterion exists for analytical discipline.
The 24-hour rule. For any unplanned trade larger than 1% of portfolio, impose a 24-hour cooling-off period between the urge and the order. This rule alone disarms the vast majority of bias-driven trades. The cost in genuinely missed opportunities is minimal; the cost in avoided mistakes is substantial.
The decision journal. Every trade gets a journal entry: thesis, expected return, time horizon, calibrated probability, kill criteria. Review the journal annually. The gap between your forecasted outcomes and the realized outcomes is the data that humbles overconfidence and re-calibrates future decisions. Without a journal, every trade looks brilliant in retrospect; with a journal, the actual record is humbling and corrective.
An accountability partner or fiduciary advisor. For investors who can afford it, a fee-only fiduciary advisor doing periodic check-ins captures most of the behavioral-coaching benefit without the conflicted-incentive structure of commission-based advice. Vanguard's Advisor's Alpha framework values the behavioral-coaching component of advisor relationships at up to 1.5 percentage points per year — the single largest source of advisor-added value, larger than asset allocation or tax efficiency. For DIY investors, the cheaper substitute is an investor friend or partner who reviews your trades quarterly and pushes back honestly.
The 2025 Retail Surge: Same Biases, Bigger Megaphone
The behavioral landscape changed quantitatively but not qualitatively in 2024–2026. Retail trading volume in 2025 hit fresh highs — roughly 60% above 2024 and approximately 17% above the 2021 meme-stock peak, with the retail share of cash-market turnover climbing to roughly 45% in 2024 from approximately 33% five years earlier. The biases driving this volume are not new — herd mentality, FOMO, overconfidence, recency — but the surface area has expanded substantially, and the speed at which collective behavior coordinates has compressed from days to minutes.
Four current-cycle case studies make the mechanics visible:
- Long-Term Capital Management (1998). A hedge fund staffed by Nobel laureates that took on roughly $1 trillion in leveraged exposures and collapsed in five weeks during the Russian default crisis. The textbook case of overconfidence — analytical brilliance and academic credentials are not protection against bias when the model assumes correlations that break under stress.
- GameStop (January 2021). Coordinated retail buying through r/wallstreetbets drove the stock to nine-figure valuations against fundamentally unchanged business economics. Herd mentality at scale, social proof as the dominant signal, with late-entrant retail buyers providing exit liquidity to earlier participants. The 2025 retail surge cited above is the same playbook, broader.
- The dot-com bust (2000–2002). Investors who anchored on 1999 valuations and held through the multi-year unwind because "this can't be the bottom" demonstrated anchoring and sunk-cost biases at index level. The Nasdaq took 15 years to recover its 2000 high in nominal terms; many individual names never did.
- 2008 panic selling. Loss aversion plus recency plus availability cascading into mass equity exits at exactly the wrong time. The S&P 500 bottomed at 666 in March 2009 and roughly tripled over the following five years — but the average investor who sold during the 2008 panic missed most of that recovery.
The lesson across the four cases is the same: the biases that produce the behavior gap have been documented since at least the 1970s. The trading environment has changed; the mechanics have not.
Related Article: Sustainable Investing: Aligning Values with Financial Goals
Behavioral Coaching at the App Layer
The institutional response to the documented retail behavior gap is increasingly product-level. Vanguard quantifies behavioral coaching alone at up to 1.5 percentage points per year, the largest single component of an advisor's added value. Betterment, Wealthfront, Zerodha's "Nudge" feature, and INDmoney all now ship behavioral nudges at the order level — historical-context reminders before sell orders during drawdowns, friction prompts on attention-induced trading patterns, and explicit warnings on concentration trades.
For investors using a fiduciary advisor or a major robo-advisor, much of the behavioral guardrail is already partially installed. For self-directed investors managing their own portfolios, the DIY equivalent is the toolkit above: notifications off, P&L hidden, 24-hour rule, decision journal, IPS in writing, accountability partner. None of this is sophisticated. The discipline is in actually using it.
What the institutional behavioral-coaching premium tells us is that the value is real and quantifiable — investors who have someone (or something) interrupting their System 1 impulses do measurably better than those who do not. The question for any individual investor is not whether the coaching is worth it; it is whether to pay for the institutional version, install the DIY version, or accept the documented 1.2 percentage point annual cost.
What Would Change My Mind on the Behavior-Gap Thesis
The thesis underneath this article is that disciplined retail investors who install pre-commitment devices (IPS, kill criteria, cooling-off rules, decision journals, automated rebalancing) substantially close the 1.2 percentage point gap that Morningstar documents — not by becoming more rational, but by removing the moments where System 1 controls the trading decision. The structural friction is the mechanism; the gap is the cost of not having it.
What would change my mind? One thing, specifically: a multi-year meta-analysis showing that investors who follow the disciplined practices above (verified through journal data, not self-report) do not close a meaningful share of the behavior gap. The early academic evidence — including Vanguard's Advisor's Alpha framing, the documented impact of automated rebalancing, and the brokerage-level data on attention-induced trading — points the other direction. But the field is still building the longitudinal datasets that would let us know with high confidence how much of the gap is mechanical (closable with structural friction) versus genuinely cognitive (irreducible regardless of process). If the answer turns out to be that most of the gap is irreducible — that humans simply cannot hold the discipline regardless of the rules they wrote — the implication is to outsource more of the decision-making to robo-advisors or fee-only fiduciary advisors. I do not currently believe the data supports that conclusion, but it is the disconfirming case I am watching for.
Until that data shifts, the framework above is the right answer for an individual retail investor: name the biases you actually run, install the friction tactics that interrupt them, write down the rules before you need them, and accept that the discipline of not deviating from the plan is most of what professional investors actually do that retail investors do not.
For the theoretical foundation — the bias library, the academic lineage, the Loss Aversion λ debate, the Fear & Greed Index mechanics, and the longer-form treatment of how biases connect to the foundational behavioral finance literature — see the companion piece on behavioral finance and the 10 biases costing investors 848 bp in 2024. This piece is the field manual; that one is the textbook.
This article is for educational purposes only and is not individual financial advice. Behavioral patterns vary by individual, market regime, and account context. The studies and statistics cited above represent the current state of the field; effect sizes and methodologies remain under active academic debate. Consult a licensed financial advisor for guidance matched to your specific situation, and read each fund's prospectus before allocating capital.
Frequently Asked Questions
Investor psychology is the study of how cognitive biases and emotions shape investment decisions. According to Morningstar's 2025 Mind the Gap study, the gap between fund returns and investor returns averaged 1.2 percentage points per year over the decade ending December 31, 2024 — meaning psychology costs the average investor about 15% of their funds' aggregate returns.
Recency bias is the tendency to weight the last few weeks or months of market action more heavily than the longer-term track record. Investors who bought hot tech in late 2024 because tech had been hot in 2024 — and got hit by the early-2025 drawdown — were acting on recency bias. The counter-tactic: anchor decisions to 10-year averages, not 90-day charts, and rebalance on a schedule.
The disposition effect is the tendency to sell winning positions too early and hold losing positions too long, often to avoid 'locking in' a loss. It's been documented since Shefrin and Statman's 1985 work and remains one of the most measurable investor biases. The fix: pre-write stop-loss and take-profit rules before you open the position; ask 'would I buy this at today's price?' independent of cost basis.
Three rules. First, write an Investment Policy Statement (IPS) before any drawdown — it codifies your rebalancing rules so you don't decide in panic. Second, enforce a 24-hour rule between feeling the urge to sell and placing the order. Third, automate rebalancing via your broker so the discipline isn't in your hands. Morningstar's 2025 Mind the Gap shows sector-fund investors lose ~1.5% per year to exactly this behavior.
Herd mentality is the tendency to copy what other investors are doing — especially during rallies or panics — instead of acting on your own analysis. 2025 retail trading volume hit ~60% above 2024 and ~17% above the 2021 meme-stock peak, with social-media coordination on Reddit and X driving much of the move. The fix: write a one-sentence thesis before any trade. If you can't articulate why the position works independent of the crowd, don't take it.
FOMO (fear of missing out) is buying a position primarily because the price is rising or because others are buying — not because of fundamentals. A 2024 Journal of Behavioral Finance study found 68% of crypto investment decisions were driven by FOMO rather than technical analysis. Counter-tactic: maintain a written watchlist with pre-set entry criteria, and only buy when your criteria — not the headline — trigger.
Significantly — and mostly negatively. The average US FinTok user logged 416 hours of finance video in 2025, but DayTrading.com's April 2026 audit found 75% of viral investing TikToks scored C-or-worse on accuracy, and 0% earned an A. The algorithm rewards urgency and confidence — the two emotional triggers that drive FOMO and overconfidence biases. Treat social-media tips as topic suggestions, never as buy signals.
Overconfidence bias is overestimating your ability to predict markets, time entries, or pick winners. It's especially dangerous in 0DTE options trading, where retail traders lose 4.7% on average per trade vs +0.19% on non-0DTE option trades — a measurable cost of believing you can outguess a one-day move. Counter-tactic: track every trade in a journal with a written thesis and a calibrated probability; the gap between your forecast and reality will humble the bias quickly.
Loss aversion — formalized by Kahneman and Tversky's prospect theory — is the finding that losing $100 hurts roughly twice as much as gaining $100 feels good. In practice it shows up as holding losers too long, refusing to rebalance into a falling asset class, and over-allocating to 'safe' assets after a drawdown. The compounded cost of loss-aversion-driven mistiming shows up in Morningstar's 2025 1.2 pp/yr behavior gap.
Increasingly, yes — but you have to opt in. Vanguard's Advisor's Alpha framework values behavioral coaching alone at up to 1.5 percentage points per year, and broker apps like Betterment, Zerodha Nudge, and INDmoney now ship behavioral nudges (delayed-order friction, historical-context reminders, panic-sell warnings). The DIY equivalent: disable push notifications, hide your P&L by default, set a 24-hour cooling rule before any unscheduled trade, and automate rebalancing.