
Harnessing Real Estate: Strategies for Successful Property Investment


The number worth opening with for real estate investment strategies in 2026 is not the median home price. It is the FHFA's new conforming loan limit: the 2026 baseline jumped to $832,750, with the high-cost ceiling at $1,249,125, effective January 1. What that figure actually measures is how much home a household can finance with conventional, conforming-rate financing — and where the cliff sits beyond which more expensive jumbo loans take over. What it does not tell us is whether any given investor should be buying at those levels in 2026, which depends on a substantially longer list of factors than the headline ever covers.
This guide treats real estate investing in 2026 the way an institutional analyst would: as an asset class with named strategies, measurable returns, real tax architecture, and a longer historical arc that frames each current debate. The 2024–2026 environment has changed the calculus in ways most real-estate-investing content has not yet caught up to — falling mortgage rates, expanded conforming limits, the post-Sitzer commission settlement, the permanence of Opportunity Zones under the OBBBA, and a January 2026 executive order restructuring how institutional capital competes with retail investors for inventory. Each is consequential. Each affects which strategies make sense for which investors. None of what follows is individual financial advice; sizing decisions belong to a licensed financial advisor who knows your full situation.
The 2026 real estate landscape
Three macro variables are setting the tone for 2026. NAR Chief Economist Lawrence Yun's December 2025 forecast projects mortgage rates falling toward 6.0% in 2026, down from approximately 7.0% at the start of 2025; existing-home sales are projected to rise 14% year-over-year; home prices are forecast to grow approximately 4%. Whether the forecast holds is its own empirical question. What matters for strategy decisions is that the directional consensus across institutional research points to a falling-rate, recovering-volume year. Strategies that depend on refinance access (BRRRR) become more attractive. Strategies that depend on falling cost of capital (REITs) get a structural tailwind.
The 2026 conforming loan limits — $832,750 baseline, $1,249,125 high-cost — also expand the leverage available to investors using conventional financing on second-home and 1–4-unit non-owner-occupied properties. For a Bay Area duplex that was jumbo-only in 2024, conforming financing is now possible. The strategy implication is straightforward: house hacking and small-multifamily investing have a wider geographic playable footprint in 2026 than they did two years ago.
The Sitzer/Burnett buyer-agent commission case closed with a $52.25 million NAR settlement on April 10, 2026. Average buyer-agent rates fell from 2.87% to 2.82%; total commissions sit at 5.70% (down from 5.80% pre-settlement). The investor-relevant shift is that buyer-agent compensation is now decoupled from MLS listings, which means the fee is explicitly negotiable on every deal — and the difference is meaningful at the property-level cash-flow analysis.
A January 2026 executive order titled "Stopping Wall Street from Competing with Main Street Homebuyers" restricted institutional purchases of single-family homes, with a carve-out allowing institutions to undertake renovations. The carve-out is the part most investor-facing content underplays. Institutional capital is now competing with retail BRRRR and fix-and-flip operators in the rehab segment, not the buy-and-hold segment. Deal sourcing for rehab inventory has gotten harder for retail; off-market, distressed, and wholesaler channels matter more than they did in 2024.
Opportunity Zones became permanent under the One Big Beautiful Bill Act, signed July 4, 2025. After December 31, 2026, capital gains deferral becomes a rolling 5-year window with a 10% basis step-up at year 5; rural QROFs receive a 30% step-up. New designations roll out July 1, 2026. This is the single largest tax change for real estate investors in the cycle.
These five facts — rates, loan limits, commissions, the Wall Street order, OZ permanence — are the inputs to any 2026 strategy decision. The rest of this guide threads them through.
Six investment strategies compared
Real estate is not one strategy. It is at least six, with very different capital, time, and risk profiles.
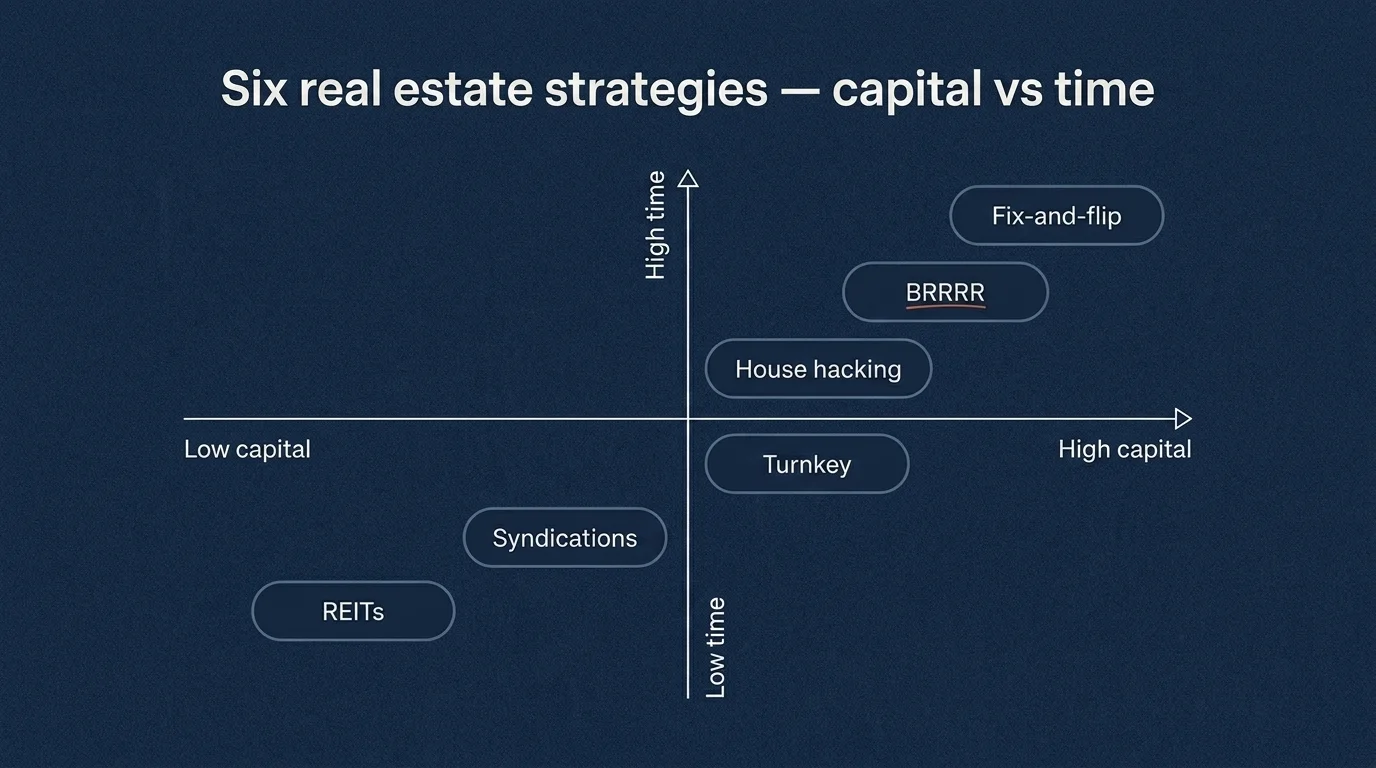
| Strategy | Capital required | Time commitment | Expected return range | Risk level | Best for |
|---|---|---|---|---|---|
| BRRRR | $40K–$150K + financing | 10–20+ hrs/week | 15–30% IRR, infinite CoC after refi | High | Hands-on investors with rehab competence |
| House Hacking | 3.5%–10% down + reserves | 5–10 hrs/week | Reduced living costs + $50–150K equity in 5 yrs | Moderate | First-time investors, owner-occupants |
| Fix-and-Flip | $50K–$200K + financing | 30+ hrs/week | 15–25% per project | High | Experienced operators, short time horizon |
| Turnkey Rental | $30K–$80K down per door | 1–3 hrs/week | 5–10% CoC, 8–12% total return | Moderate | Passive cash flow, busy professionals |
| REITs | $100+ | Minimal | 6–10% total return, 3–5% dividend | Moderate | Pure passive, liquidity needs |
| Syndications / Crowdfunding | $5K–$100K+ per deal | Minimal | 8–15% target, illiquid | Moderate-high | Accredited investors (most syndications), passive |
A few notes on each:
BRRRR — Buy, Rehab, Rent, Refinance, Repeat. Buy below market, fund a rehab that lifts appraised value, place a tenant, refinance to pull most or all cash out, redeploy into the next deal. The 2026 falling-rate environment makes the "refinance" leg cheaper, which has real consequences for deals stuck in 2023–2025 at 7%+ rates. A defensible purchase basis, a realistic rehab budget, and a pre-vetted refinance path are non-negotiable before closing.
House hacking — buy a 2–4 unit property, occupy one unit, rent the rest. Owner-occupied financing (FHA at 3.5% down, VA at 0% down) provides the cheapest leverage in real estate. 55% of Millennial buyers in 2026 cite house hacking as "very or extremely important" in their purchase decision. A worked example circulated by AmeriSave: a $380,000 triplex in a market with reasonable rents reduces housing costs to roughly $920/month and builds approximately $90,000 in equity over five years on a $21,300 cash investment. The numbers vary by market; the structural advantage of owner-occupied leverage does not.
Fix-and-flip — buy below market, rehab, sell. Higher capital intensity than BRRRR (no rental income during hold), shorter time horizon, more cyclical sensitivity. The 2026 institutional-renovator competition matters most here: the Wall Street EO carve-out lets institutional capital compete for rehab inventory.
Turnkey rental — buy a property already renovated and tenanted, often in a different market than where you live, through a turnkey operator. Lowest active time commitment; the trade-off is paying a markup to the operator and accepting limited control over property selection.
REITs — buy publicly traded shares of companies that own and operate income-producing real estate. Lowest capital requirement, highest liquidity, no operational involvement. Covered in detail below.
Syndications and crowdfunding — pool capital with other investors into specific deals (apartment buildings, commercial properties, development projects). Most direct syndications are limited to accredited investors; crowdfunding platforms (Fundrise, RealtyMogul, Arrived) opened the category to non-accredited investors with lower minimums but typically with platform fees and lock-up periods.
The right strategy is a function of the four inputs that drive every real-estate decision: how much capital you can deploy, how much time you can spend, your risk tolerance, and your liquidity needs. None of the six strategies is universally best. Each is best for a specific investor profile.
Deal analysis math: cap rate, cash-on-cash, the 1% rule
The quickest way to separate disciplined real estate analysis from narrative-driven investing is to insist on the math. Three numbers govern most retail deal analysis.
Cap rate = Net Operating Income ÷ Purchase Price.
Worked example: a $350,000 duplex in a stable mid-tier market generates $2,800/month in gross rents and $1,400/month in NOI after operating expenses (taxes, insurance, vacancy reserve, maintenance, management — but excluding debt service). Annual NOI is $16,800. Cap rate is $16,800 ÷ $350,000 = 4.8%.
That number is a property-level return on the asset, independent of how it's financed. A 4.8% cap rate in a major metro is reasonable; in a Sunbelt secondary market it might signal underpriced or might signal a deal with hidden problems. Cap rates compress in strong markets and widen in weak ones — both because of changes in NOI and because of changes in what investors will pay for a given NOI.
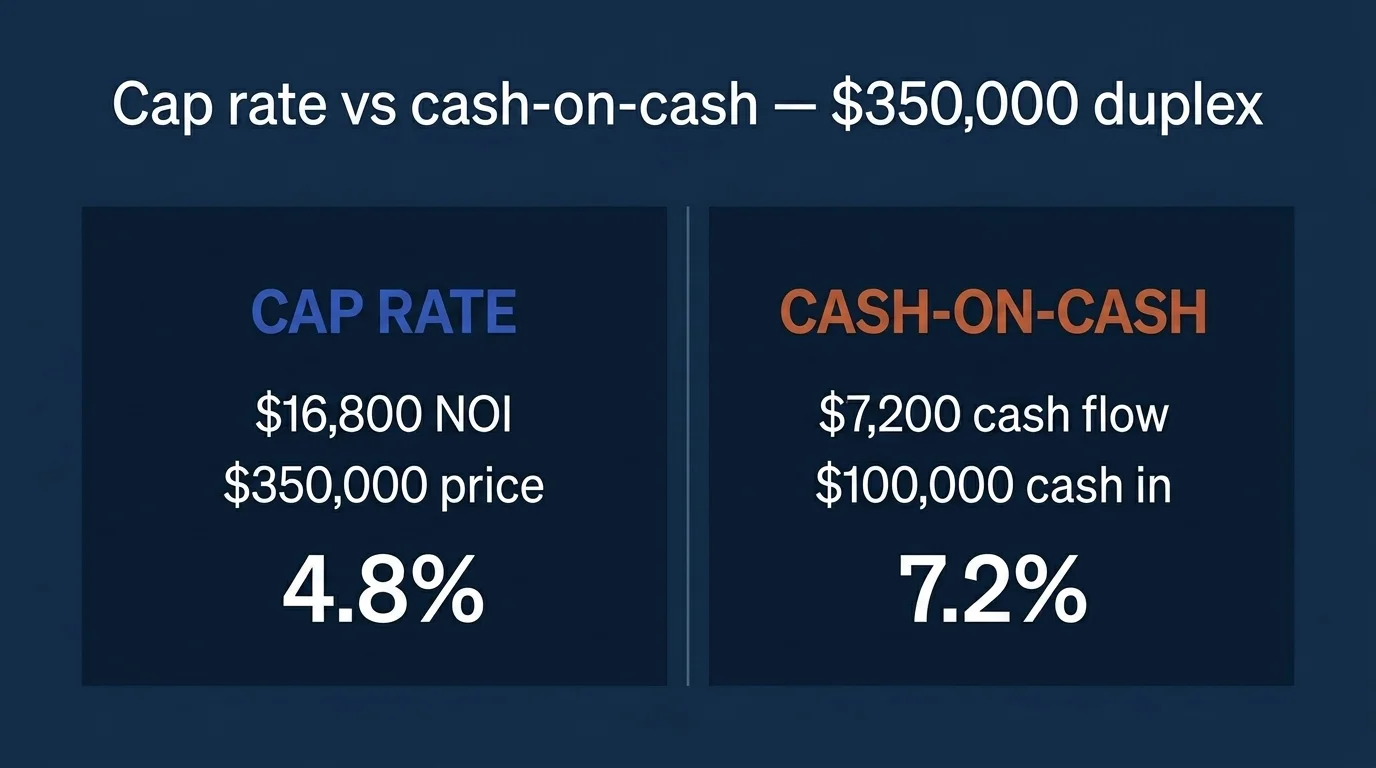
Cash-on-cash return (CoC) = Annual Pre-Tax Cash Flow ÷ Total Cash Invested.
Continuing the same example: assume 25% down on the $350,000 purchase ($87,500), $12,500 in closing and reserves — total cash in = $100,000. Annual cash flow after debt service (a 75% LTV, 30-year mortgage at 6.5% adds roughly $1,660/month in principal and interest, or $19,920/year) is $16,800 − $19,920 = −$3,120 in this rate environment. Negative cash flow.
Run the same property at 6.0% (the 2026 forecast rate): debt service drops to roughly $18,840/year. Cash flow becomes $16,800 − $18,840 = −$2,040. Still negative.
Run it at 25% down with rents of $3,200/month gross / $1,800 NOI ($21,600/year): cash flow is $21,600 − $18,840 = $2,760. CoC = $2,760 ÷ $100,000 = 2.76%.
The point of the exercise: small changes in rent, NOI assumptions, or interest rates flip the same property between mediocre and unattractive. Investors who skip this math are paying for it in below-pro-forma returns. Investors who do it find that the deal that looked great at the open house frequently doesn't pencil at all once debt service and reserves are honestly priced.
The 1% rule — monthly rent should equal at least 1% of the purchase price — is a quick screening filter, not an analysis. A $300,000 property meeting the 1% rule rents for $3,000/month. The rule has gotten increasingly hard to clear in major metros over the past decade; it now functions mostly as a screening cutoff for which markets to even research.
Real estate is a math business. The narrative is downstream of the numbers.
REITs in 2026: types, sectors, and the rate-cut tailwind
REITs (Real Estate Investment Trusts) are companies that own, operate, or finance income-producing real estate and trade like stocks. They are the most accessible real estate investment vehicle for retail investors — minimum investment is the price of a single share, liquidity is intraday, and dividends typically meet IRS distribution requirements that exceed conventional equity income.
The three structural categories worth knowing:
- Public REITs (traded on major exchanges): VNQ (Vanguard Real Estate ETF), SCHH (Schwab US REIT ETF), IYR (iShares US Real Estate ETF) are the broad-market index examples. Sector-specific ETFs cover industrial, residential, healthcare, data center, and more.
- Non-traded public REITs (registered with the SEC but not exchange-traded): higher fees, longer lock-ups, sometimes higher target returns. Risk-return profile is meaningfully different from public REITs.
- Private REITs (not registered): only available to accredited investors, even less liquid, often used by institutional allocators. Most retail investors should not be in these.
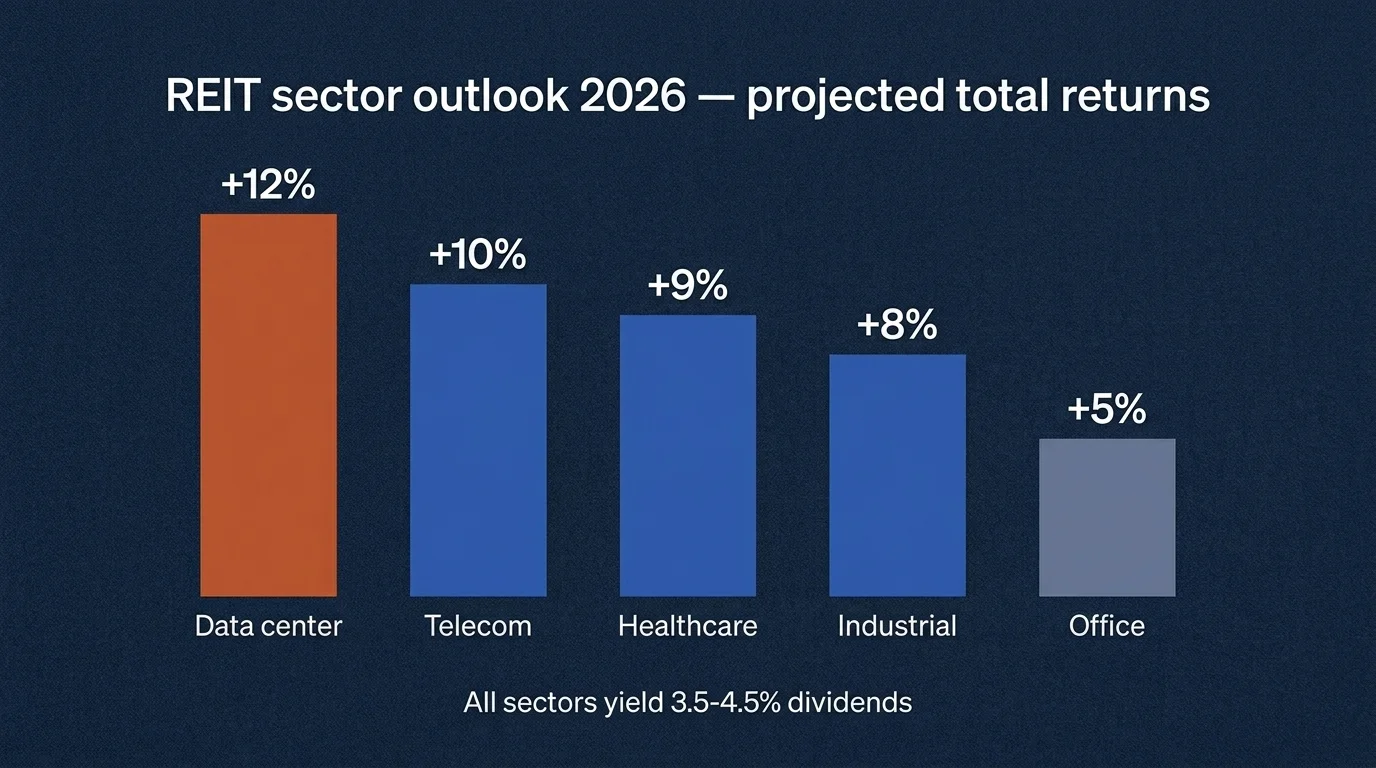
For retail investors, the REIT decision is rarely about picking sectors. It is about whether REITs belong in your portfolio at all, what allocation, and via which wrapper (taxable brokerage, IRA, or 401(k) where REITs are tax-efficient because the dividend obligation passes through tax-free in the wrapper). Sizing decisions belong with a planner who knows your full situation.
Tax-advantaged real estate: 1031 exchanges and Opportunity Zones
Tax-advantaged real estate is meaningful precisely because real estate generates ordinary-income rental cash flow and capital gains on disposition. The two primary mechanisms for deferring or reducing those taxes are 1031 exchanges and the new (post-OBBBA) permanent Opportunity Zone framework.
1031 exchange — Section 1031 of the Internal Revenue Code allows an investor to defer capital gains tax on the sale of an investment property by exchanging it for "like-kind" property within strict deadlines: 45 days to identify the replacement property, 180 days to close. The proceeds must be held by a qualified intermediary, never touch the seller's hands. Properly executed, the gain is deferred indefinitely — and on death, the heirs receive a stepped-up basis, eliminating the deferred tax. 1031 exchanges are the workhorse tax-deferral tool for real estate investors who plan to redeploy proceeds into other investment property.
Opportunity Zones (post-OBBBA) — The OBBBA, signed July 4, 2025, made Opportunity Zones permanent. For investments after December 31, 2026, capital gains deferral becomes a rolling 5-year window with a 10% basis step-up at year 5; rural Qualified Opportunity Funds (QROFs) receive a 30% step-up. New zone designations roll out July 1, 2026. Compliance reporting includes penalties up to $50,000 for funds with $10 million or more in assets that fail to comply. The QOZ versus 1031 decision is a real one in 2026 — both defer capital gains, but they have different mechanics, different time horizons, and different additionality requirements (QOZ funds must invest in qualified-zone property; 1031 has no geographic restriction).
The honest version: both mechanisms work well for the right investor. Both have failure modes. A 1031 exchange that misses the 45-day or 180-day deadline triggers immediate gain recognition. A QOZ investment in a poorly-managed fund can lose more than the tax savings. The decision belongs in a tax professional's hands, not a blog post's.
Mid-term rental: the regulatory hedge for STR investors
Short-term rental (STR) investing — the Airbnb / Vrbo model — has produced some of the highest gross yields in residential real estate over the past decade and some of the most aggressive municipal regulation. Cities including New York, San Francisco, Los Angeles, Honolulu, and many others have layered registration requirements, occupancy caps, and outright bans on sub-30-day rentals.
The 2026 hedge that's emerged: mid-term rentals (MTR), defined as 30+ day stays. By exceeding the typical municipal STR threshold, MTR rentals avoid most STR-specific ordinances. The target tenant personas — travel nurses on 13-week contracts, remote workers relocating temporarily, insurance-displaced families during home repair, corporate housing — produce 2–3x long-term rent at lower turnover than nightly rentals. Furnishing, cleaning, and management are simpler than nightly STR operations.
The trade-off is occupancy. Travel nurses don't always extend; corporate placements have gaps; insurance displacement is unpredictable. A well-located MTR in a hospital district or near a major employer can match or beat full-time STR yields with materially lower regulatory risk. A poorly-located MTR can sit empty for months. The underwriting requires honest occupancy assumptions and a backup pricing strategy (drop to long-term rent if MTR demand thins).
For investors actively targeting STR markets, the practical 2026 question is not "should I do STR or long-term," but "should I structure this for nightly rentals (high yield, regulatory risk) or 30+ days (slightly lower yield, much lower regulatory risk)." The answer increasingly favors the longer stay window.
House hacking: how to start with limited capital
For investors entering real estate without significant capital, house hacking is the durable answer. The mechanics are straightforward: buy a 2–4 unit owner-occupied property using FHA (3.5% down) or VA (0% down) financing, live in one unit, rent the others. The owner-occupied financing is the cheapest leverage available in U.S. residential real estate.
Working through the AmeriSave example: a $380,000 triplex with an FHA 3.5% down ($13,300) plus reserves and closing costs (~$8,000) puts the investor in the deal with approximately $21,300 cash. Conservative rent assumptions on the two non-occupied units cover most of the mortgage, taxes, and insurance, reducing the investor's net housing cost to approximately $920/month. Five years of disciplined occupancy plus principal paydown plus market appreciation produces approximately $90,000 in equity. That return on $21,300 is approximately 322% over five years — and the strategy required no specialized expertise beyond reading the mortgage paperwork and being a reasonable landlord to two neighbors.
The strategy's structural advantage is the FHA/VA financing. The trade-off is that owner-occupancy is required for at least 12 months under FHA rules. After that period, the investor can move out, retain the property as a pure rental, and repeat the strategy with another owner-occupied loan if the lender allows. Sequential house-hacking — moving into a new owner-occupied property every 12–18 months and converting the previous one to a rental — is one of the fastest ways to build a 4–6 property rental portfolio without significant outside capital.
The post-Sitzer commission negotiation lever
Most real-estate-strategy guides treat the Sitzer settlement as background. For active investors, it is a direct cash-flow lever. Buyer-agent commissions are now decoupled from MLS listings and explicitly negotiable on every transaction; average rates fell from 2.87% to 2.82%, with total commissions at 5.70%.
A worked example for a $400,000 BRRRR purchase: at the 2.82% average buyer-agent fee, the buyer side pays $11,280 in commission (paid by seller, but baked into purchase price economics). Negotiating the buyer-agent fee to 1.5% — using a flat-fee buyer agent or a compensation arrangement directly with the brokerage — saves $5,280. On a deal with $100,000 cash invested, that $5,280 is roughly 5.3 percentage points of year-one return improvement before any operating performance.
The negotiation is harder than the math. Buyer agents earn their fee for some buyers (off-market sourcing, complex negotiations, market analysis); for others, the agent's marginal contribution is small relative to the fee. Investors who write 5+ offers per quarter, who source their own deals via wholesalers or off-market channels, or who use flat-fee buyer agents are extracting most of the post-Sitzer value. Investors who use a traditional buyer agent in a routine retail transaction are paying largely as before.
Wall Street vs Main Street: institutional capital and the rehab carve-out
The Trump executive order signed in January 2026 — formally titled "Stopping Wall Street from Competing with Main Street Homebuyers" — restricted institutional purchases of single-family homes but created a carve-out allowing institutional capital to undertake renovations. The political signal pointed at curbing institutional buy-and-hold competition. The practical effect, for retail BRRRR and fix-and-flip operators, is that institutional capital is now competing for rehab inventory specifically.
The implication: deal sourcing has gotten harder for retail rehabbers. The MLS isn't the channel where the work happens anymore. Off-market sourcing through wholesalers, direct-mail campaigns to distressed owners, courthouse-step auctions, and probate listings are where retail flippers and BRRRR operators are finding inventory that hasn't already been bid up by institutional rehab teams. The 2026 environment rewards investors with sourcing networks; it punishes investors who depend solely on retail market listings.
Community-oriented real estate: a different lens
The investment strategies above are framed in conventional financial-return terms. There is a parallel real estate ecosystem that frames itself differently — community land trusts, affordable-housing covenants, mission-related investment funds — and that operates inside a longer historical arc connecting back to the redlining-and-fair-housing reform era and forward to the present community-investment movement.
A small community-owned affordable-housing fund I have been tracking has quietly returned approximately 4.2% net to investors over the past five years while holding a permanent affordability covenant on every unit. That return number is not a headline. It is below market for residential real estate. But the covenant means every unit will remain affordable to households at or below 80% of area median income in perpetuity, and that obligation survives any sale of the underlying property.
The reason this matters as a category is that the analytical question changes. Most real-estate-investment content asks: "What return can I generate?" Community-oriented real estate asks: "What, specifically, remains true about this investment after I exit it, and for whom?" The covenant-protected unit remains affordable. The market-rate unit reverts to whatever the market clears. Both are real estate. Only one of them produces a durable second-order effect.
This is not the same as a values-aligned screen on a conventional REIT. It is a structurally different set of vehicles with different return profiles, often illiquid, often impact-targeted, sometimes operated by community land trusts or mission-related investment programs. They are not for every investor. They are also not adequately captured by the standard real-estate-strategy framing.
The honest framing for a 2026 retail investor: most readers of this guide will allocate to conventional vehicles (REITs, direct ownership, syndications). A small subset will look at community-oriented real estate as part of a broader values-aligned allocation. Both choices are defensible. The question worth asking is not which is right in general, but which is right given what you want your capital to do beyond financial return.
What I'd ask before deploying capital
In the spirit of how an institutional analyst frames any allocation decision: here are the questions worth answering before any specific real estate investment, and the question worth holding open across the entire allocation decision.
Per-investment questions:
- What is the property-level return (cap rate)? What is the leveraged return (CoC)? Have I run the math at three different rent and rate scenarios?
- What is my honest holding-period assumption? Five years? Ten? Indefinite? The strategy that wins changes materially with horizon.
- What is my exit plan? Sell to whom, at what price, with what tax consequences?
- What is the regulatory risk profile? Sub-30-day STR ban, rent control, tenant protections in my market — what could change in the next five years?
- What is the operational time commitment, and have I costed it accurately?
Across the allocation:
What does my real estate exposure actually accomplish, beyond financial return? Who benefits from each strategy I'm considering — the household I'm housing, the community my investment touches, the tenants in the buildings I'm buying? Who bears the cost when something goes wrong? These are questions the conventional return-on-capital framing does not foreground, and they are the questions that distinguish capital that compounds for the investor alone from capital that compounds for the investor while leaving the surrounding community better off.
That is real estate investing in 2026 as I would frame it for an institutional analyst on day one of a residential-real-estate rotation. None of it is individual financial advice. All of it is starting material for a conversation with a licensed financial advisor or tax professional who knows your specific situation.
Frequently Asked Questions
BRRRR stands for Buy, Rehab, Rent, Refinance, Repeat. You buy below market, fund a rehab that lifts the appraised value, place a tenant, refinance to pull most or all of your cash out, and redeploy it into the next deal. The 2026 falling-rate environment makes the refinance leg cheaper than it was at peak rates, but a defensible purchase basis, realistic rehab budget, and pre-vetted refinance path are non-negotiable before closing. The strategy requires hands-on operational involvement and rehab competence.
Yes. 55% of Millennial buyers in 2026 cite house hacking as very or extremely important to their purchase decision. With FHA at 3.5% down or VA at 0% down on owner-occupied 2-4 unit properties, the math holds: a $380,000 triplex example shows housing costs reduced to approximately $920/month and approximately $90,000 in equity built in five years on a $21,300 cash investment. The 2026 conforming loan limits ($832,750 baseline; $1,249,125 high-cost) expand the markets where the strategy works.
REITs typically benefit from falling rates through lower borrowing costs, valuation expansion, and increased demand for yield. J.P. Morgan projects approximately 10% total returns for well-positioned REITs in 2026 (6-7% earnings growth + ~4% dividend yield). Data center, telecom, and healthcare REITs are the largest beneficiaries; 2026 dividend growth is forecast at 2.8% with specialty REITs leading at $20 billion in distributions.
The One Big Beautiful Bill Act (signed July 4, 2025) made Opportunity Zones permanent. For investments after December 31, 2026, capital gains deferral becomes a rolling 5-year window with a 10% basis step-up at year 5; rural QROFs receive a 30% step-up. New zone designations roll out July 1, 2026 and remain in effect for 10 years. Compliance reporting penalties reach $50,000 for funds with $10 million or more in assets that fail to comply.
As of April 2026, average buyer-agent commissions dropped from 2.87% to 2.82% post-Sitzer; total commissions sit at 5.70%. NAR settled the buy-side case for $52.25 million on April 10, 2026. For investors, this is direct negotiation leverage: on a $400,000 purchase, dropping the buyer-agent fee from 2.82% to 1.5% saves $5,280 — adding roughly 1-3 percentage points to year-one cash-on-cash returns.
Cap rate = Net Operating Income / Purchase Price. Example: a $350,000 duplex generating $1,400/month NOI ($16,800/year) has a cap rate of 4.8%. Cash-on-cash return = Annual Pre-Tax Cash Flow / Total Cash Invested. Same property, $87,500 down + $12,500 closing/reserves = $100,000 cash in; if annual cash flow after debt service is $7,200, cash-on-cash equals 7.2%. The 1% rule (monthly rent >= 1% of purchase price) is a quick screening filter, increasingly hard to clear in major metros.