Navigating Volatile Markets: Strategies for Investors

The number worth opening with is not the S&P level. The standard gauge of U.S. equity market volatility — the VIX, the CBOE Volatility Index that prices expected 30-day S&P 500 movement — as of late April 2026 is sitting at 18.60, with a 52-week range of 13.38 to 35.30, and is down 26.15% over the prior twelve months. The S&P 500 is at 7,130. Brent crude is up more than 85% year-to-date, the largest single-driver inflation force in the cycle.
What that VIX number actually measures is the implied volatility priced into S&P 500 options for the next thirty days — a forward-looking estimate of how much the market expects itself to move. What it does not tell us is whether the realized volatility will match the implied number, what the catalyst for the next move will be, or what your specific portfolio is going to do in any given week. It tells us where the market is paying for fear today, not where the market is going.
This is a guide to investing in volatile markets in 2026 — what volatility is and is not, what the 2025 tariff drawdown taught the people who lived through it, why "stay invested" is not advice and "stay invested and diversify" is, what defensive stocks look like in this cycle, how dollar-cost averaging works mathematically (and why it is no longer framed as a beginner tactic), how safe-haven assets compared during the 2025 drawdown, and a drawdown-depth playbook for what to do at -5%, -10%, -15%, and -20%. None of it is individual financial advice. All of it is starting material for a conversation with someone licensed to look at your specific facts.
What market volatility actually is (and what the VIX measures)
Volatility is the magnitude of price variation over a period of time. The VIX is its most-quoted proxy for U.S. equities — derived from the prices market makers are paying to write options on the S&P 500. A VIX of 12 corresponds roughly to expectations of a 0.75% daily S&P 500 move; a VIX of 30 corresponds to roughly a 1.9% daily move; a VIX above 40 historically only occurs during financial-crisis-grade events.
The shorthand most market participants use:
- Below 15: complacent / low-stress.
- 15–25: normal / elevated alertness.
- 25–35: meaningful stress.
- Above 35: panic / crisis-grade.
The current VIX of 18.60 sits in the normal range — despite an environment of significant tariff-cycle uncertainty and oil-price spikes. That is itself a meaningful signal: the option market is not currently pricing crisis.
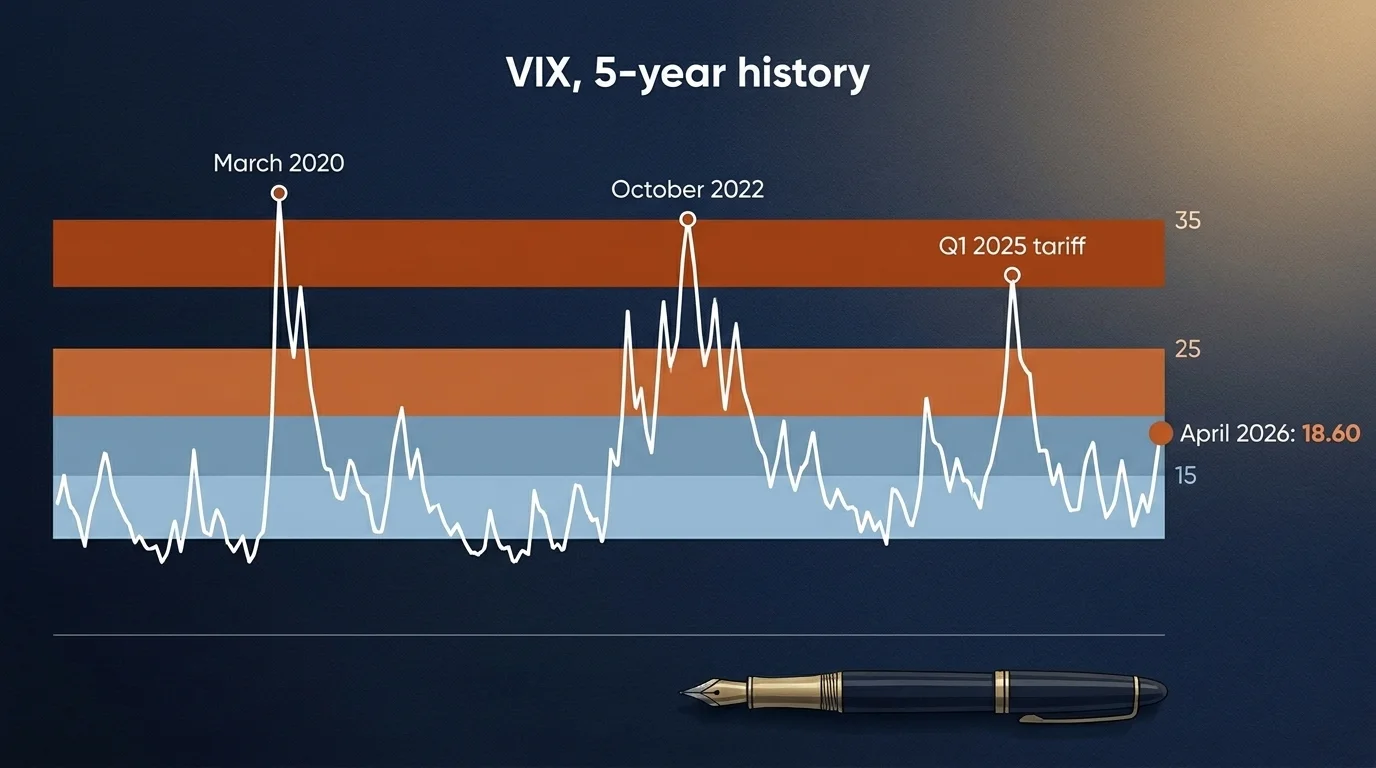
Two limits of the VIX are worth naming explicitly. First, it is forward-looking, not predictive — it tells you what insurance is being priced at, not what will actually happen. The VIX has historically peaked AFTER major drawdowns more often than before them. Second, it is U.S.-equity-centric. Volatility in fixed income, credit, currency, commodities, and crypto is not captured. The MOVE Index does the same job for Treasuries, the OVX for crude oil, the BVIX for bitcoin. A complete volatility picture across asset classes uses several gauges, not one.
Volatility is not, by itself, a measure of risk in the long-horizon sense. A long-term investor cares about the probability and magnitude of permanent capital loss, not the standard deviation of monthly price moves. Conflating the two — treating a 2% down day as a "loss" rather than a paper mark — is the error that drives most of the bad behavior I have watched across two crypto cycles and the broader 2020 and 2022 equity events.
The 2025 tariff cycle case study
The S&P 500 declined nearly 20% from mid-February through early April 2025, the sharpest non-recession drawdown since 2022 — driven primarily by trade-policy uncertainty and the early-2025 tariff cycle. It is worth treating this as a case study because it is recent enough that the lessons are still operational, and because most of the institutional volatility content predating mid-2025 does not reference it.
What worked, and is now part of the consensus playbook:
- Continued contributions to broad-market index funds through the drawdown. Investors who paused or stopped buying caught fewer cheap shares; those who kept the cadence accumulated more.
- Defensive sector tilt. Consumer staples, healthcare, and utilities outperformed the broader index through Q1-Q2 2025. Not by much in absolute terms, but the difference between -10% and -18% over a few months has real psychological consequences for whether someone keeps the strategy or abandons it.
- Cash and short-duration Treasuries as a stabilizer. With Treasury yields near 4%, holding 5-10% of the portfolio in short-duration paper gave investors both real positive yield and the optionality to deploy at the bottom.
- Geographic rotation away from concentrated U.S. tariff exposure. Strategists in 2026 are explicitly recommending Japanese and South Korean equities as volatility hedges against U.S. tariff cycles, while remaining cautious on Chinese equities. The rotation began during the 2025 drawdown and has hardened.
What did not work, and is now part of the cautionary playbook:
- High-beta concentrated tech bets without a hedge. The Mag 7 tech complex took a larger drawdown than the broader index. Investors with 50%+ portfolio concentration in those names saw materially worse outcomes than equally-equity-weighted investors with diversified exposure.
- Leveraged ETFs through volatile sideways periods. Daily-rebalancing leveraged products decay during volatile sideways markets even when the underlying index ends roughly flat. This is well-documented mechanically; the 2025 cycle was another live demonstration.
- Selling on the way down without a re-entry plan. The most expensive single decision in this cycle was the panic-sell. The recovery began in early April 2025 and the investors who had not pre-committed to a re-entry rule were still on the sidelines when the recovery accelerated.
The honest version of this case study is that none of it is new. Diversify, keep contributing, do not panic-sell, hold short-duration fixed income for stability, mind concentration. The market has been teaching this lesson for a hundred years and continues to. What changes is which sectors are the volatility flashpoint and which look like the resilient defensive trades. That part requires fresh data, which is why a 2024 article on volatility no longer serves a 2026 reader without an update.
Stay invested AND diversify: the institutional consensus
The "stay invested" posture has hardened across institutional research over the last two years. The data underlying it is unambiguous on the long horizon and useful even when uncomfortable on the short one.
U.S. stocks delivered positive returns across all 20-calendar-year rolling periods through 12/31/23. That is every twenty-year window in modern history, including periods that began in 1929 and 2000. Long-horizon equity exposure, held through drawdowns, has been the most reliable wealth-builder available to retail investors. The honest version of the limit: this record is for the U.S. equity market specifically. Other countries have different long-horizon records.
In 80% of the prior 15 years that experienced intra-year selloffs, balanced portfolios still finished the year positive. The within-year drawdown is the visible part. The full-year outcome is the part that compounds.
What "stay invested" does not mean is "do nothing." It means: do not panic-sell, do continue contributions, do rebalance toward target allocation, do harvest tax losses where appropriate. The work continues during a drawdown. The error is liquidating into the drawdown.
Diversification is the second half of the consensus and has been mathematically demonstrated since Markowitz formalized it in 1952. Combining assets whose returns are imperfectly correlated produces a portfolio with lower volatility than the weighted average of its components — at the cost of a modest reduction in expected return. The trade is favorable on a risk-adjusted basis.
What diversification does not protect against is systematic, market-wide drawdowns. In a 2008-style or 2020-style crisis, correlations across most asset classes converge toward 1.0. Diversification compounds patiently in normal markets and disappoints in tail events. That is a known limit and a real one.
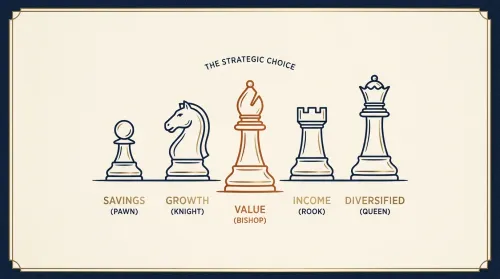
Defensive stocks: where money hides in a drawdown
Defensive stocks are companies whose products people buy regardless of the economic cycle: consumer staples (toothpaste, packaged food, household cleaning supplies), healthcare (pharmaceuticals, medical devices), and utilities (electricity, water, gas). Their earnings volatility is structurally lower than that of cyclicals, so their price drawdowns tend to be shallower in equity bear markets.
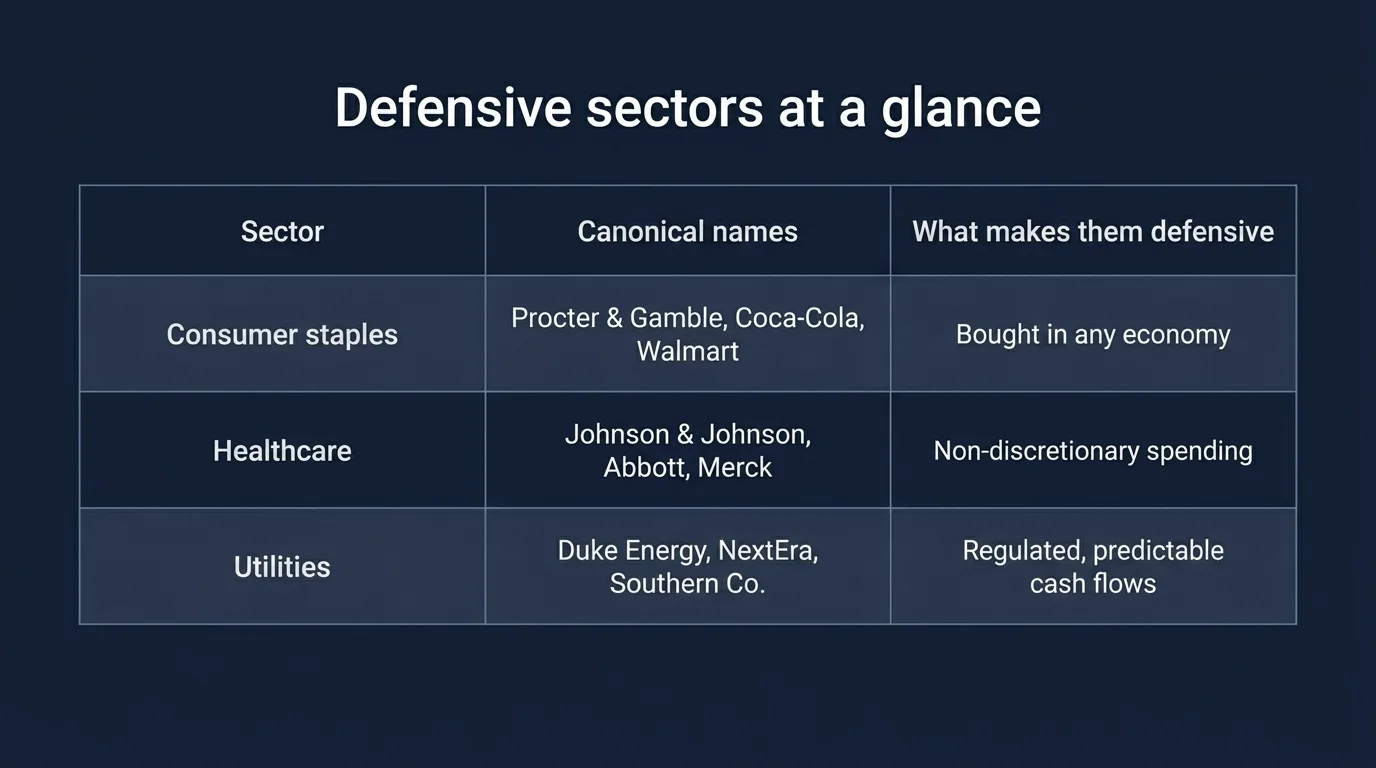
The names that show up most often in coverage of this category include:
- Consumer staples: Procter & Gamble (PG), Coca-Cola (KO), PepsiCo (PEP), Walmart (WMT), Costco (COST), Colgate-Palmolive (CL), Kimberly-Clark (KMB).
- Healthcare: Johnson & Johnson (JNJ), Abbott (ABT), Merck (MRK), Eli Lilly (LLY), UnitedHealth (UNH).
- Utilities: Duke Energy (DUK), NextEra Energy (NEE), Southern Company (SO), Dominion (D), American Electric Power (AEP).
These are descriptive examples — the canonical defensive names. They are not recommendations to buy. Sizing any of them in your portfolio belongs to a licensed financial advisor who knows your existing exposure, tax situation, and time horizon.
The trade-off worth naming explicitly: defensive sectors do not just outperform less in drawdowns — they also tend to underperform in strong bull markets. Holding 100% defensives means giving up most of the equity-market premium that drives long-run wealth creation. The institutional pattern is a tilt, not a wholesale rotation. A 5–10 percentage-point overweight in defensives going into a feared drawdown, paid for by a corresponding underweight in cyclicals or high-beta tech, is the recognizable defensive lean.
For investors who do not want to single-stock-pick, sector ETFs offer the same exposure in a diversified wrapper. The names that show up most often in coverage are XLP (Consumer Staples Select Sector SPDR), XLV (Health Care), and XLU (Utilities) — and the equivalents at Vanguard (VDC, VHT, VPU) and Fidelity. A planner can size these positions inside the broader allocation framework.
Related Article: Red vs. Blue: The Battle of Colors in Investment Marketing
Dollar-cost averaging through volatility
Dollar-cost averaging — investing a fixed dollar amount at a fixed cadence regardless of price — is no longer framed by major institutions as a beginner tactic. Fidelity, American Century, and Bernstein now position DCA primarily as a bear-market accumulation tool — buying more shares at lower prices. The reframing is correct, and the math is the reason.
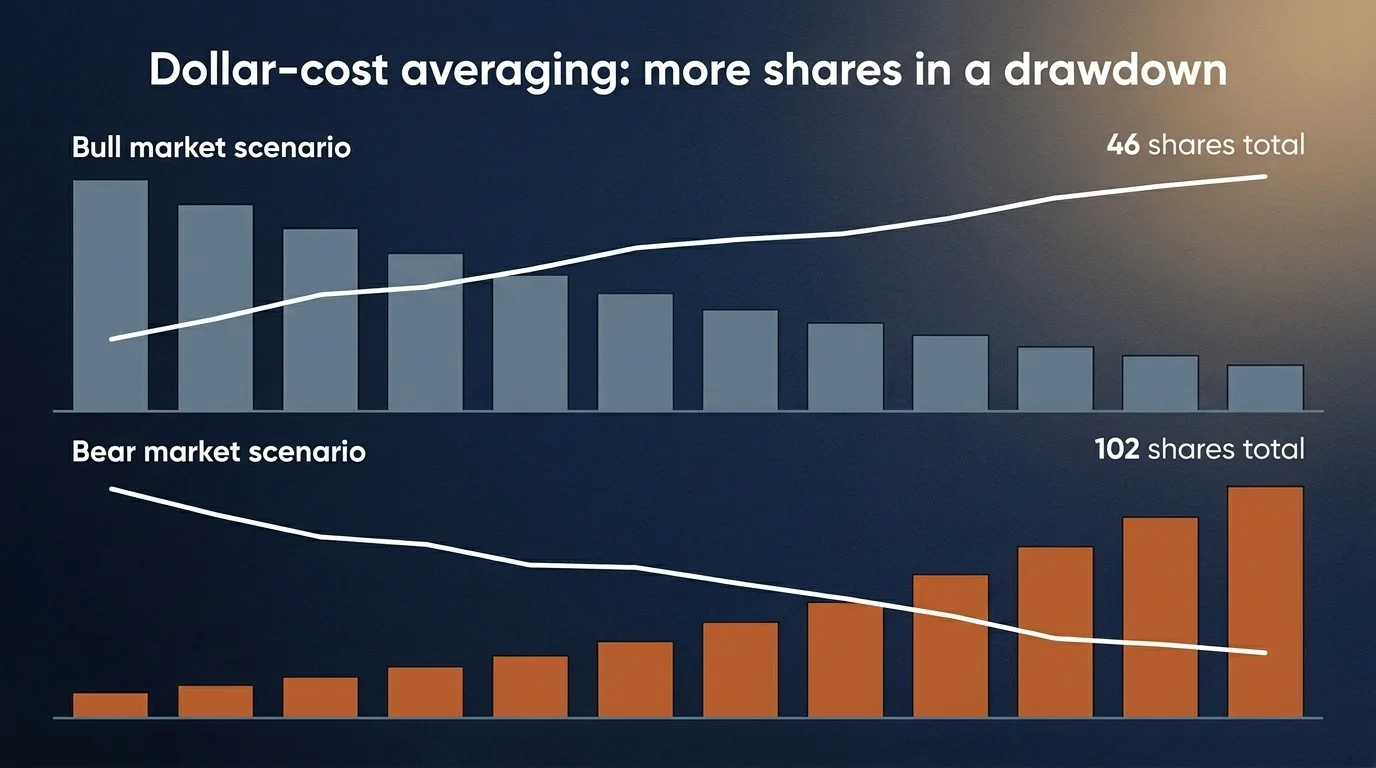
Fidelity's worked example: $250 per month yields 102 shares at an average price of $29.39 in a hypothetical bear market scenario — versus only 46 shares at an average price of $64.62 in a hypothetical bull market. Same dollars, 2.2x the share count, at less than half the average cost basis.
When the recovery comes — and historically it has, the post-2008 diversified portfolio took 52 months to return to its pre-crisis high — those extra shares are what compounds. The investor who paused contributions through the drawdown captures the recovery only on the position they already held. The investor who continued captures the recovery on a materially larger share count.
The mechanical version a household can implement:
- Decide on a fixed monthly contribution amount inside an automatic brokerage transfer.
- Allocate it across a small number of broad funds (a total-market U.S. fund, an international fund, possibly a defensive sector tilt).
- Do not adjust the cadence based on price level. The cadence is the strategy.
- Re-evaluate the contribution amount once a year as your income or planning circumstances change — not in response to short-term market moves.
DCA is not a market-timing tool. It is the opposite — it is the explicit removal of timing decisions from the contribution process. That is its merit.
Safe-haven assets and the alternatives lens
Safe-haven assets are investments that historically appreciate or hold value during equity drawdowns. None of them are guaranteed safe; the term refers to a tendency, not a property.
| Safe-haven category | Behavior in equity drawdowns | Honest limit |
|---|---|---|
| Gold | Tends to appreciate during currency stress and crisis events | Pays no yield; can lag during stable bull markets |
| Short-duration Treasuries | Provide real positive yield (~4% in 2026) and capital stability | Real return depends on inflation; price-sensitive to rate moves |
| JPY / CHF | Currency safe havens during global risk-off | Currency translation adds a separate variable |
| Managed futures | Trend-following funds often profit during sustained directional moves | Can lose money during choppy ranges; high fees in many wrappers |
| Bitcoin | Uncorrelated with equities at long horizons; brutal correlation during liquidity events | Volatility is several multiples of equities; sizing is critical |
Treasury yields sit near 4% across the curve — the first time since pre-2008 that core bonds offer real positive yields after inflation. For the first time in a decade, holding Treasuries pays you to wait. That changes the cost of holding "dry powder" in a portfolio — it is no longer a cash drag.
Gold during the 2025 drawdown performed as the textbook predicts: it appreciated while equities fell, and underperformed during the subsequent rally. The five-to-fifteen-percent gold sleeve recommended in many 2026 outlook pieces is consistent with the long-horizon Sharpe-ratio data: gold has delivered better risk-adjusted returns than its absolute returns suggest because of its drawdown behavior, not despite it.
Bitcoin is the asset class I cover most often in my own writing. The honest version for a volatility-playbook context: bitcoin has historically had low long-run correlation with traditional risk assets, but it correlates brutally with equities during liquidity events when leverage unwinds across asset classes. A small allocation (1-5% for non-specialist investors) for diversification rationale is defensible. A larger allocation is a directional bet on bitcoin specifically, not a diversification trade. Know which one you are taking.
2026 institutional outlooks now routinely recommend infrastructure, secondary-market private equity, and equity long/short hedge fund exposure as core volatility hedges. JPMorgan Q1 2026 explicitly increased its exposure to equity long/short and relative value strategies. JPMorgan's positioning includes neutral 6.2-year portfolio duration, 2% overweight in U.S./European high yield, and underweight core bonds. That is one institutional posture among many; the reason to cite it is that it represents a coherent allocation under stated assumptions. Whether your household allocation should look like JPMorgan's depends on facts I cannot see from a blog post.
A volatility playbook by drawdown depth
Most volatility content is descriptive — what is happening, why, what might come next. The prescriptive version is more useful: at a given drawdown depth from a portfolio peak, what specifically is the right action set? The ladder below is a starting framework, not a substitute for an advisor who knows your situation.
| Drawdown from peak | What it usually is | What to do |
|---|---|---|
| -5% | Routine market noise | Nothing. Continue contributions. Verify nothing structural changed in your plan. |
| -10% | Standard correction (occurs ~once per year) | Continue contributions. Check if any sleeve has drifted ≥5pp from target — rebalance if so. |
| -15% | Notable correction (occurs ~every 18 months) | Continue contributions. Rebalance if drift triggers. Consider tax-loss harvesting in taxable accounts. |
| -20% | Bear market threshold | Continue contributions if income permits. Re-affirm time horizon and emergency reserve. Defensive tilt if not already in place. |
| -30% or worse | Crisis-grade event (2008, 2020 March) | Continue contributions if income permits. Avoid leveraged positions. Verify FDIC/SIPC coverage on accounts. Talk to your advisor. |
The pattern is intentional: the action set does not change much by drawdown depth in absolute terms. What changes is the urgency and the order of operations — but the answer is rarely "panic-sell," and is rarely "double down with leverage." The answer at every depth is roughly: keep doing what your plan says, verify nothing structural broke, rebalance toward target allocation, and avoid the asymmetric mistakes (leverage, liquidating to cash, abandoning DCA) that turn a drawdown into a permanent capital impairment.
The 52-month post-2008 recovery duration cited above is the operative reference. Drawdowns end. The market did not stay below its 2008 peak. The market did not stay below its 2020 March low. The market did not stay below its 2022 low. The investors who held diversified positions through each of those events compounded. The investors who liquidated did not. That is the consistent lesson of every cycle I have lived through.
Investor psychology: fear, greed, and the CNN index
Markets are made by humans, and humans systematically misprice fear and greed. The CNN Fear & Greed Index aggregates seven sub-indicators (price momentum, market breadth, junk bond demand, put/call ratios, market volatility itself, and others) into a single 0-100 score. It is not a trading signal. It is a sentiment thermometer.
The empirical regularity it tracks: extreme fear readings (below 25) historically precede above-average market returns over the following 6-12 months, and extreme greed readings (above 75) historically precede below-average returns. The cause is selection: when sentiment is extreme, the marginal investor is making a sentiment-driven decision that is statistically wrong on average. Your behavioral edge as a long-horizon investor is doing the opposite of the marginal sentiment trader — buying when fear is extreme, holding when greed is extreme, and ignoring the index entirely between those poles.
The honest limit: this regularity is statistical, not deterministic. Extreme fear can persist for months. Extreme greed can persist longer. Acting on the index as a market-timing tool produces worse results than ignoring it and DCA-ing through the cycle. The right use is psychological: when you feel an urge to panic-sell, look at the index — if it is below 25, the urge you are feeling is the same urge millions of other investors are acting on, and the historical record says acting on it is wrong.
Fear and greed compound through social media in ways they did not in prior cycles. The 2022 crypto collapses I lived through inside a fund were accelerated by Twitter at a speed and scale that pre-Twitter cycles did not see. The 2025 tariff cycle showed the same dynamic in equities: sentiment rotated within hours, not weeks. The behavioral edge available to a disciplined investor in 2026 is larger than it was in 2010, not smaller, because the marginal investor is responding to faster signals.
What this guide does not tell you
In keeping with my own rule about disclosing the limits of any analysis:
- Whether to make any specific allocation change today. That is between you and a licensed advisor who knows your full situation. I have explained the framework. I have not told you to allocate.
- Where the next drawdown comes from. I do not know. Anyone who claims to is either selling something or about to be wrong on the record.
- Whether the 2026 second-year-of-presidential-cycle pattern repeats. Historically, second years average nearly 20% sell-offs. The base rate is meaningful. The base rate is not predictive.
- What the post-tariff inflation regime looks like in 2027. Brent crude up 85% YTD has not yet fully passed through to consumer prices. The lag is six to nine months. We will know more in Q4 2026 and Q1 2027.
- How crypto behaves in the next equity drawdown. Bitcoin's correlation with equities has been positive during liquidity events historically. Whether the structural shift to spot-ETF ownership changes that pattern is an open empirical question. I do not know the answer yet.
What would change my view on the framework above: a sustained breakdown of the long-run positive equity record across rolling 20-year windows, a permanent regime shift in stock-bond correlation that makes diversification arithmetically less effective, or a structural change in how Treasuries respond to crisis (the 2022 episode tested this; the post-2022 episodes have largely confirmed Treasuries still work as a stabilizer). I am watching all three. None has happened.
That is the volatility playbook for 2026 as I would walk a friend through it. None of it is individual financial advice. All of it is the starting material for a conversation with the person licensed to translate it into a plan for your specific facts.
Frequently Asked Questions
Market volatility is the magnitude of price variation in a market or asset over a period of time. The CBOE Volatility Index (VIX) is the standard gauge for the U.S. equity market, derived from S&P 500 option prices. Below 15 is complacent, 15–25 is normal, 25–35 is elevated, above 35 is crisis-grade. Volatility creates short-term paper losses for long-horizon investors and short-term opportunities for tactical ones. The behavioral mistake most investors make is treating short-term volatility as risk in the long-horizon sense; long-term risk is the probability of permanent capital loss, not the standard deviation of monthly moves.
Selling during a drawdown locks in losses and risks missing the recovery — Fidelity data shows U.S. stocks delivered positive returns across every 20-year rolling period through 12/31/23, and that 80% of years with intra-year selloffs still finished positive on a balanced portfolio basis. Most investors are better served by continuing scheduled contributions (which buy more shares at lower prices) and rebalancing toward target allocation rather than liquidating. Individual circumstances vary; consult a licensed advisor.
Yes — and arguably better than in bull markets. The same monthly dollar amount buys more shares at lower prices. Fidelity's worked example shows $250 per month buys 102 shares at an average $29.39 in a hypothetical bear market versus only 46 shares at $64.62 in a hypothetical bull market — same dollars, 2.2x the share count, less than half the average cost basis. When the recovery comes, those extra shares are what compounds.
Defensive stocks are companies whose products people buy regardless of the economic cycle: consumer staples (Procter & Gamble, Coca-Cola, PepsiCo, Walmart, Costco), healthcare (Johnson & Johnson, Abbott, Merck), and utilities (Duke Energy, NextEra, Southern Company). Their earnings volatility is structurally lower than cyclicals, so their price drawdowns tend to be shallower in bear markets. They also tend to underperform in strong bull markets — a tilt is more common than a wholesale rotation.
Diversification reduces unsystematic risk — the variance specific to individual securities or sectors — by combining assets whose returns are imperfectly correlated. The result is a portfolio with lower volatility than the weighted average of its components, at a modest reduction in expected return. The trade is favorable on a risk-adjusted basis. Diversification does not protect against systematic, market-wide drawdowns when correlations across most asset classes converge — a known limit and a real one.
Gold has historically appreciated during equity drawdowns and currency-stress events, making it one of the most consistent safe-haven assets. The 2025 tariff drawdown reinforced the pattern. The honest limits: gold pays no yield, can lag during stable bull markets, and the appropriate sleeve size for most retail portfolios is in the 5–15% range. As with any allocation question, sizing belongs to a licensed advisor who knows your full situation.
Yes, if drift triggers your rebalancing rule. The 5/25 rule — rebalance when any asset class drifts more than 5 percentage points absolute or 25% relative from target, whichever comes first — gives a clean trigger. Rebalancing during a drawdown forces buying assets that are now undervalued and trimming those that have held up. It is one of the few systematic ways to 'buy low, sell high' without market-timing.
Historically about 9–18 months in equities, with full recovery timelines of 1–5 years. After the 2008 financial crisis, a diversified portfolio took 52 months to return to its pre-crisis high (Fidelity). The recovery duration depends on the depth of the drawdown and the trajectory of policy response — every cycle is different, but the consistent record across modern history is that drawdowns end and disciplined investors who held through them compounded.