The Ultimate Guide to Building a Diverse Investment Portfolio

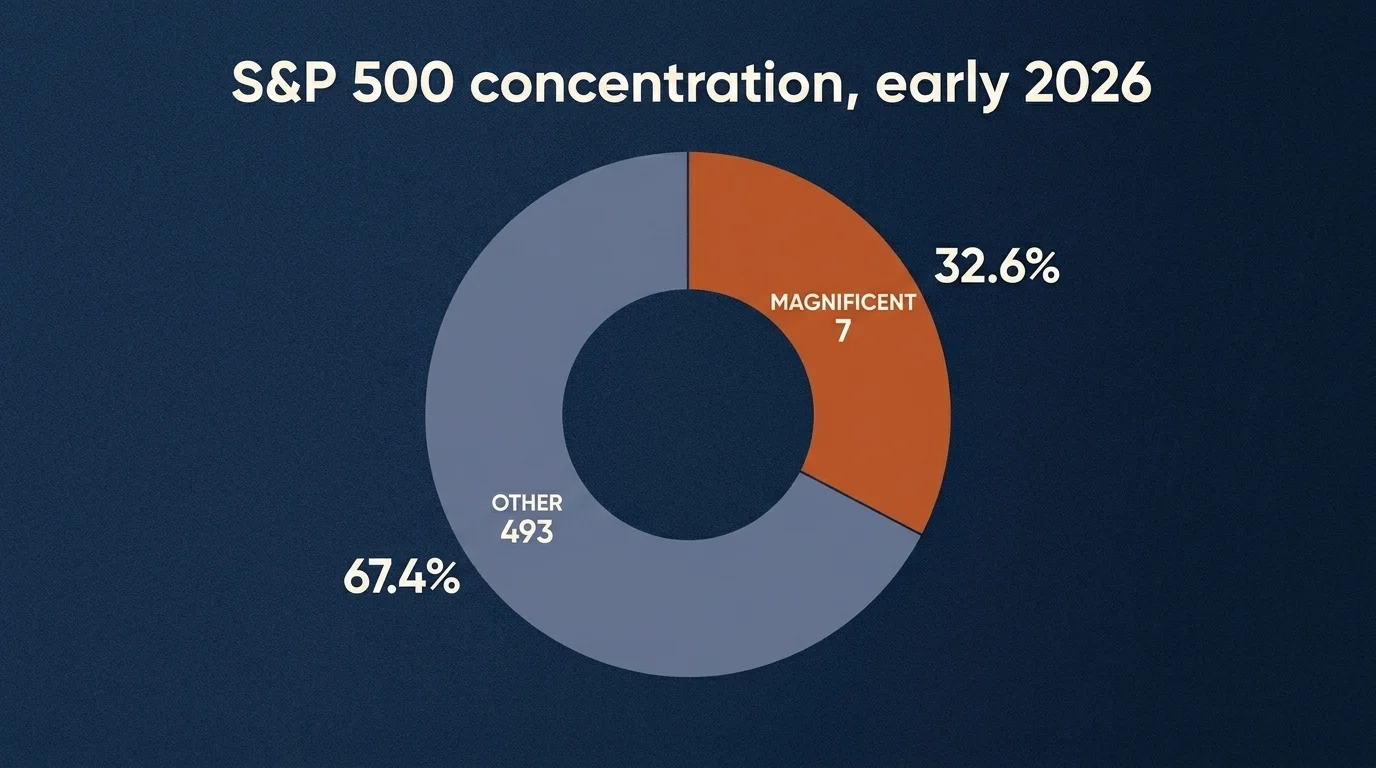
The number worth opening with is not a return figure. As of early 2026, the seven largest companies in the S&P 500 — the so-called Magnificent Seven — account for roughly 32.6% of the index's total market capitalization. What that number actually measures is the share of an index marketed as "diversified" that is now concentrated in seven names. It tells you that an investor holding a single S&P 500 fund and calling it diversification is, in mathematical terms, doing something else. A diversified investment portfolio in 2026 is not what it was in 2014, and the framework for building one has to account for that fact before it accounts for anything else.
This is a guide to building one — covering what diversification actually does mathematically, what changed after 2022, how the institutions that manage real money are allocating today, sample portfolios you can ladder against your own situation, and the rebalancing rule that separates a strategy from a wish. I am not your advisor; individual circumstances belong to a licensed one. But the framework below is the one a CFA charterholder would teach a new analyst on day one, and it has not changed — only the inputs have.
What diversification actually does
Diversification reduces unsystematic risk — the variance specific to individual securities or sectors — without proportionally reducing expected return. The honest, slightly dry version: combining assets whose returns are not perfectly correlated produces a portfolio whose volatility is lower than the weighted average of its components' individual volatilities. That is the entire mathematical insight, and it has been peer-reviewed for seventy years.
What diversification does not do is what most people think it does. It does not protect against systematic risk — the variance shared across all assets. In a 2008-style or 2020-style market dislocation, correlations across most asset classes converge toward 1.0 and everything sells off together. Diversification compounds patiently in normal markets and disappoints in tail events. That is the trade-off, and a portfolio designed without acknowledging it is a portfolio whose owner is going to be unhappy at exactly the wrong moment.
A second misconception worth naming: owning many different individual stocks in the same sector is not diversification. Owning Apple, Microsoft, Alphabet, Nvidia, Amazon, Meta, and Tesla is owning seven correlated bets on the same secular thesis. The Mag 7 concentration figure above is the operative example.
Modern Portfolio Theory in plain English
Harry Markowitz, working at the University of Chicago in 1952, formalized the observation that a portfolio's risk is not the average of its components' individual risks — it is a function of their correlations. The practical implication is the efficient frontier: for any given level of expected return, there is one combination of assets that minimizes variance. Sit on that curve and you are using risk efficiently. Sit beneath it and you are taking risk you are not being paid for.
In plain English: combining a stock fund with a bond fund (whose returns are imperfectly correlated with stocks) produces a portfolio with a lower volatility than a pure-stock portfolio at only a small reduction in expected return. The "free lunch" of diversification is not free — it is a re-allocation of variance. But the math says you are getting a better deal per unit of risk than you would by holding stocks alone or bonds alone.
The framework is descriptive, not prescriptive. MPT does not tell you which assets to buy or what the future correlation matrix will be. It tells you that, given a set of expected returns and correlations, there exists a most-efficient portfolio. The work of an investor is estimating those inputs honestly. Most allocation mistakes come from trusting an estimate (especially of correlation) to the second decimal place when the first decimal is already uncertain.
The post-60/40 reality: what changed in 2024–2026
For four decades, the 60/40 portfolio — 60% equities, 40% investment-grade fixed income — was the institutional default for moderate-risk, long-horizon capital. It worked because U.S. stocks and bonds tended to move in opposite directions during equity drawdowns. Bonds were the volatility-suppressor. Then 2022 happened.
The 60/40 portfolio returned roughly −17.5% in 2022 — by far the worst calendar year of the modern era for the strategy — because the stock-bond correlation flipped positive for the first sustained period in two decades. Both halves of the portfolio fell together, and the instrument that was supposed to dampen equity volatility instead amplified it. The post-mortem ran the entire 2022–2023 financial press cycle: the 60/40 was either dead, dying, or simply needed to be rethought.
The actual subsequent return record is more interesting than the obituary. The 60/40 returned approximately +17.2% in 2023 and roughly +15% in each of 2024 and 2025. The framework recovered. Whether it recovered because the correlation reverted or because the rates regime shifted is an open empirical question, and the honest answer is: probably both, and not symmetrically. What the experience proved is that the 60/40 is not dead, but it is also no longer a complete solution — it works as a core, and a core needs satellites.
Apollo, Goldman Sachs, and other institutional allocators are openly promoting a 40/30/30 model — 40% equities, 30% fixed income, 30% alternatives — as the modern successor framework. The argument is structural: in a regime where stock-bond correlation can flip without warning, a third sleeve of assets that is correlated with neither (or correlated for different reasons) is mathematically valuable. Whether 40/30/30 turns out to be the new universal default or just one alternative among several, it is the version of diversification the largest pools of capital are actively migrating toward.
Asset allocation by age: a starting framework
A diversified investment portfolio is not a fixed object; it is a function of your time horizon, risk tolerance, and capital needs. Age is a rough proxy for the first of those three, and only the first.
The classical heuristic is the Rule of 110: subtract your age from 110 to get a starting equity weighting. A 35-year-old targets ~75% equities; a 65-year-old targets ~45%. The rule has limitations — it ignores wealth level, income stability, pension coverage, and risk tolerance — but as a default starting point for someone with no other constraint, it is defensible.
Within the equity sleeve, the T. Rowe Price model splits global stocks into 60% U.S. large-cap / 25% developed international / 10% U.S. small-cap / 5% emerging markets. That is one defensible breakdown; others move international higher and U.S. lower. The point of the table below is not to prescribe the percentages but to demonstrate that "equities" is not a single line in any serious portfolio.
| Age band | Target equity % | Target fixed income % | Target alternatives % | Cash % | Notes |
|---|---|---|---|---|---|
| 20s–30s | 80–85% | 5–10% | 5–10% | 0–5% | Long horizon. Volatility is the friend. |
| 40s | 70–75% | 10–15% | 10–15% | 0–5% | Begin building the alts sleeve. |
| 50s | 55–65% | 20–25% | 10–15% | 5–10% | Pre-retirement glidepath begins. |
| 60s | 45–55% | 25–30% | 10–15% | 5–10% | Sequence-of-returns risk dominates. |
| 70s+ | 30–45% | 30–40% | 10–15% | 10–15% | Income generation matters more than capital growth. |
These are starting points, not prescriptions. The right number for you is the one a licensed financial advisor recommends after looking at your full balance sheet, income, expected liabilities, and tax situation.
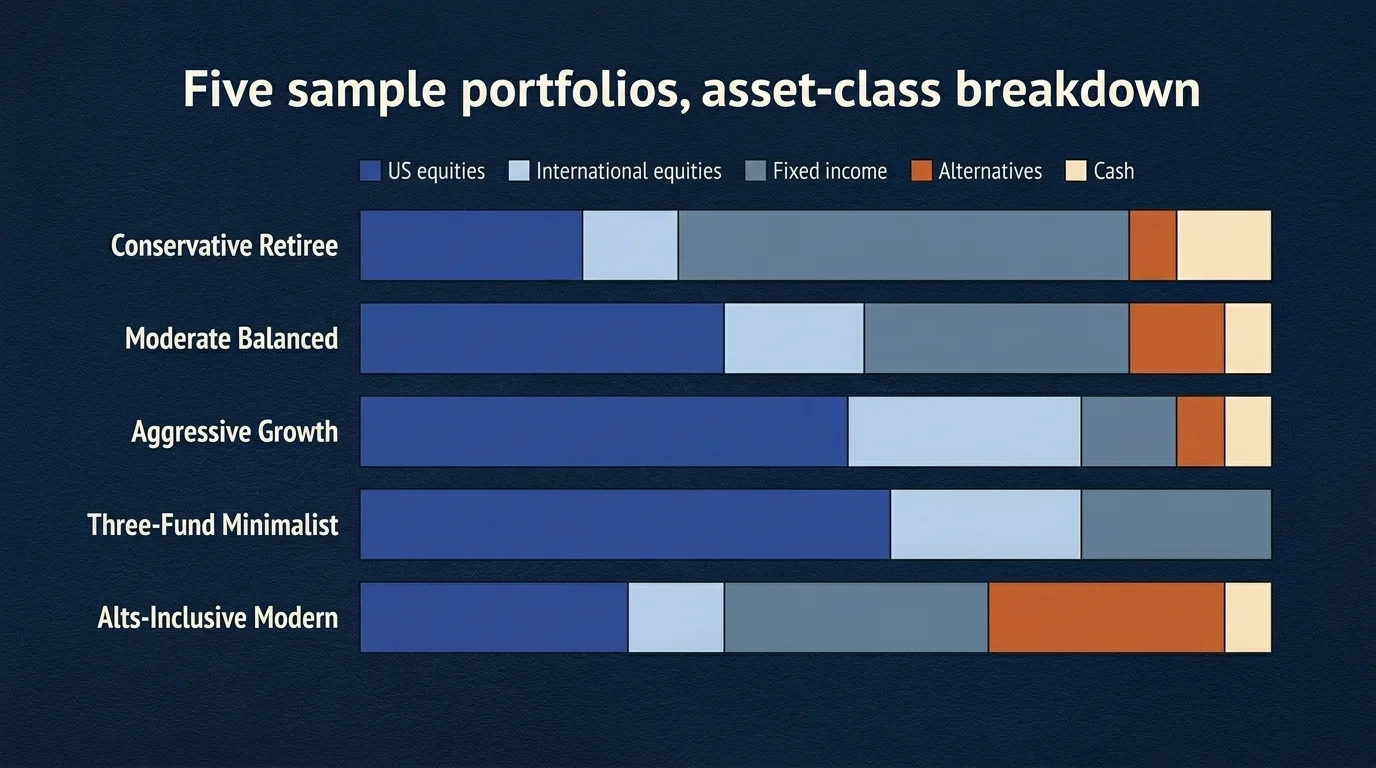
Sample portfolios: five tiered allocations
Pie charts, by themselves, are not portfolios. Tickers and percentages are. The five examples below cover the realistic range from conservative-retiree to alts-inclusive-modern, with platform-neutral fund examples — Vanguard, Fidelity, and Schwab share-class equivalents are listed where they exist — so you can implement at whatever brokerage you already use.
1. Conservative Retiree
For someone in retirement prioritizing capital preservation and income.
| Sleeve | % | Vanguard | Fidelity | Schwab |
|---|---|---|---|---|
| US total stock | 25% | VTI | FZROX | SWTSX |
| International stock | 10% | VXUS | FZILX | SWISX |
| US total bond | 35% | BND | FXNAX | SWAGX |
| Short-term Treasury | 15% | VGSH | FUMBX | SCHO |
| REITs / real assets | 5% | VNQ | FREL | SCHH |
| Cash / equivalents | 10% | VMFXX | SPRXX | SWVXX |
Expected long-run nominal return: low-to-mid single digits, with materially lower volatility than a balanced portfolio. Comparable Fidelity Conservative model has historically averaged ~5.78% annually.
2. Moderate Balanced
The traditional 60/40 with a small alts overlay.
| Sleeve | % | Vanguard | Fidelity | Schwab |
|---|---|---|---|---|
| US total stock | 40% | VTI | FZROX | SWTSX |
| International stock | 15% | VXUS | FZILX | SWISX |
| US total bond | 25% | BND | FXNAX | SWAGX |
| TIPS | 5% | VTIP | FIPDX | SCHP |
| REITs | 5% | VNQ | FREL | SCHH |
| Gold / commodities | 5% | (GLD via brokerage) | (GLD) | (GLD) |
| Cash | 5% | VMFXX | SPRXX | SWVXX |
Expected long-run nominal return: mid-to-upper single digits. Comparable Fidelity Moderate model has historically averaged ~9% annually.
3. Aggressive Growth
For long-horizon investors who can absorb drawdowns.
| Sleeve | % | Vanguard | Fidelity | Schwab |
|---|---|---|---|---|
| US total stock | 50% | VTI | FZROX | SWTSX |
| International developed | 20% | VEA | FSPSX | SCHF |
| Emerging markets | 5% | VWO | FPADX | SCHE |
| US small-cap | 5% | VBR | FCPGX | SCHA |
| US total bond | 10% | BND | FXNAX | SWAGX |
| REITs | 5% | VNQ | FREL | SCHH |
| Gold | 5% | (GLD) | (GLD) | (GLD) |
Expected long-run nominal return: upper single digits to low double digits. Comparable Fidelity Aggressive model (60% US / 25% intl / 15% bonds) has historically averaged ~9.45% annually.
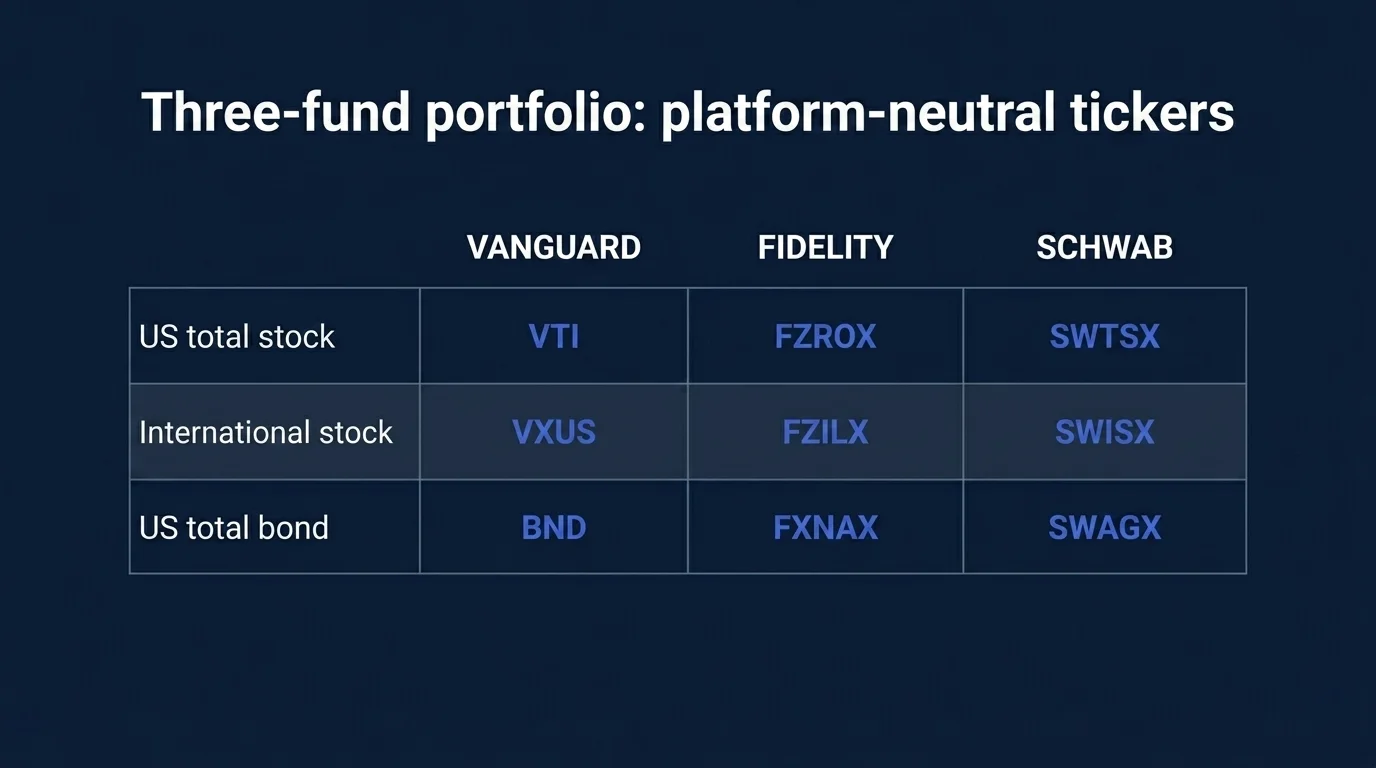
4. Three-Fund Minimalist
The Bogleheads-canon portfolio. It exists because for the median investor the difference between the canonical three funds and a more elaborate allocation is materially smaller than the cost of getting allocation wrong while trying to be sophisticated.
| Sleeve | % | Vanguard | Fidelity | Schwab |
|---|---|---|---|---|
| US total stock | 60% | VTI | FZROX | SWTSX |
| International stock | 20% | VXUS | FZILX | SWISX |
| US total bond | 20% | BND | FXNAX | SWAGX |
5. Alts-Inclusive Modern
For investors who want to mirror the institutional 40/30/30 framing.
| Sleeve | % | Vehicle examples |
|---|---|---|
| US total stock | 30% | VTI / FZROX / SWTSX |
| International stock | 10% | VXUS / FZILX / SWISX |
| US total bond | 20% | BND / FXNAX / SWAGX |
| TIPS / inflation-protected | 10% | VTIP / FIPDX / SCHP |
| Public REITs | 10% | VNQ / FREL / SCHH |
| Gold / commodities | 5% | GLD / IAU / GLDM |
| Public BDC / interval credit fund | 10% | (specific funds vary; due-diligence required) |
| Cash / Treasuries | 5% | VMFXX / SPRXX / SWVXX |
The 40/30/30 spirit, executed in publicly tradeable wrappers. The interval-fund / private-credit sleeve is the part most likely to require advice — these vehicles have liquidity and tax features that retail investors regularly mis-handle without help.
Related Article: Sustainable Investing: Aligning Values with Financial Goals
Alternative investments: beyond the velvet rope
For most of investing history, "alternatives" meant private equity, hedge funds, and other capital pools that required accreditation, multi-million-dollar minimums, and connections. As of 2026, that is no longer entirely true. 55% of investors now own at least one alternative asset; 94% of high-net-worth investors hold at least one private or alternative asset. The wrappers have democratized faster than the vocabulary has updated.
The categories worth knowing:
- Public REITs and real estate ETFs. REIT ETFs (VNQ, FREL, SCHH) trade on public exchanges, require no accreditation, and provide diversified exposure to commercial and residential real estate. The framing of REITs as a niche or exotic alternative is two decades out of date — this is the standard retail-accessible diversifier.
- Commodities and gold. Gold ETFs (GLD, IAU, GLDM) and broad commodity ETFs (DJP, PDBC) provide diversification against equity-bond correlation regimes. Historically, a 5–15% gold sleeve has improved risk-adjusted returns in many backtests — the operative word is "many"; it depends heavily on the rebalancing horizon and the starting valuation.
- Public BDCs and interval credit funds. Business Development Companies and interval funds offer access to private credit through publicly traded or semi-liquid wrappers. Moody's projects private credit AUM to exceed $2 trillion in 2026, and a growing portion is becoming retail-accessible. The trade-off is liquidity — interval funds typically allow redemptions only quarterly, with caps. Read the prospectus before owning one.
- Cryptocurrency. A speculative asset class whose appropriate retail allocation is small (most advisors cap it at 1–5% of total portfolio for non-specialist investors) and whose primary diversification rationale is its low long-run correlation with traditional risk assets. The honest version: it is uncorrelated some of the time and brutally correlated during liquidity events. Size accordingly.
- Tokenized real assets. A nascent category — fractional ownership of real estate, art, and other illiquid assets via blockchain-based vehicles. Interesting in theory, immature in practice as of early 2026. Watch the space; do not over-allocate.
The right alternatives sleeve for a retail investor is rarely larger than 15–20% of total portfolio and is usually heavily weighted toward the publicly traded wrappers (REITs, commodity ETFs) before any private or interval-fund exposure. Anything beyond that is a specialist allocation that benefits from specialist advice.
Rebalancing: the 5/25 rule and the tax-aware sequence
Roughly 30% of investors actually adhere to a rebalancing schedule. The other 70% let drift compound, which means by year three they are holding an allocation they never chose. The cost of inattention here is real and measurable — a portfolio that started 60/40 and was left untouched for ten years through the 2010s ended up well over 80/20, with the wrong risk profile for the original investor's circumstances.
Industry consensus has consolidated around the "5/25 rule": rebalance when any asset class drifts more than 5 percentage points absolute from its target, OR more than 25% relative to its target weight, whichever triggers first. Cadence: check semi-annually or annually. Quarterly checking adds turnover and tax friction without meaningful return improvement in most market regimes.
The drift triggers in practice:
- 60% target × 5pp absolute = trigger at 65% or 55% (whichever way the asset class moves).
- 5% target × 25% relative = trigger at 6.25% or 3.75%. Smaller targets are dominated by the relative rule.
The execution sequence matters more than the rule. A tax-aware rebalancing sequence runs roughly as follows:
- Cash flow first. Direct new contributions (paychecks, dividends, distributions) toward whichever sleeve is underweight. This rebalances without selling and without realizing gains.
- Dividend routing. Set dividend reinvestment to a different fund than the one paying the dividend. Equity dividends can route to bonds; bond coupons can route to equities. Mechanical, tax-free, continuous rebalancing.
- Tax-advantaged accounts first. Realize gains in IRAs and 401(k)s, where capital gains are deferred. The sale-and-rebuy moves the allocation without a current tax bill.
- Tax-loss harvesting. If the only sleeve that needs trimming is in a taxable account and is sitting on gains, look for offsetting losses elsewhere (with attention to wash-sale rules).
- Realize gains last, and only when necessary. If steps 1–4 cannot close the drift, sell — but understand the tax cost and weigh it against the magnitude of the drift.
The tax-aware version of rebalancing matters most for taxable accounts of moderate-or-larger size. Inside an IRA or Roth, just rebalance. The tax wrapper does the work for you.
What HNW investors actually do
Public surveys of high-net-worth allocations are useful not because retail investors should copy them but because they show how the framework above is implemented when the implementer has full advice and full access. The 2026 Long Angle HNW asset allocation study reports the average HNW investor holds 51% in public equities, 28% in private and alternative assets, 11% in home equity, 5% in bonds, and 5% in cash.
The headline gaps versus a typical retail allocation are visible:
- Alternatives are roughly 5x larger in HNW portfolios than in median retail (28% vs ~5%). Most of the gap is private equity, private real estate, and direct investments — vehicles retail investors usually cannot access without going through an interval fund or BDC.
- Bonds are roughly 5x smaller (5% vs ~25% in a typical balanced retail portfolio). HNW investors are using alternatives as their volatility-suppressor, not Treasuries.
- Home equity is treated as an asset class rather than ignored. For most retail investors, primary-residence equity is a much larger share of total net worth than any equity holding, but it sits outside the portfolio framework and is rarely managed.
The wealth-tier scaling continues inside HNW: investors at $2M–$10M net worth allocate ~24% to alternatives; investors at $25M+ allocate ~34%. The pattern is consistent — more capital allows more illiquidity tolerance, which allows higher alternatives weighting, which is partially what produces the higher return on capital in the first place.
The honest read: a retail investor cannot fully replicate the HNW playbook. Some of it requires accreditation, some requires capital scale to absorb illiquidity, and some requires advisory infrastructure. But the direction of the playbook — toward more alternatives and lower bonds at the margin — is replicable through the publicly traded wrappers covered above.
What would change my mind on this framework
In the spirit of how I approach any analytical thesis: here is the single variable that, if it changed, would invalidate the framework above.
The framework rests on the assumption that the long-run correlation matrix between major asset classes — equities, fixed income, alternatives, real estate — is approximately stable. Not constant, but mean-reverting around a recognizable structure. If that assumption breaks — if 2022's positive stock-bond correlation persists for a decade rather than resolving in eighteen months, or if private credit becomes correlated with public equities in a way it has not historically been — then the diversification math underlying every sample portfolio above gets weaker, not stronger. Tail-event correlation convergence is a known issue. Permanent correlation regime change is a different problem.
I am watching two indicators specifically. First: the 12-month rolling correlation between the S&P 500 and the U.S. aggregate bond index. If it stays positive for five-plus consecutive years, the case for fixed income as a volatility-suppressor weakens materially and the alternatives sleeve has to grow. Second: the dispersion of returns inside the alternatives bucket. If private credit, REITs, and commodities all start moving together with equities during stress events, the diversification benefit of the 40/30/30 frame collapses and the framework needs another sleeve.
Neither has happened yet. Both are plausible enough to watch.
That is the diversified investment portfolio framework as I would teach it in 2026. None of it is individual financial advice. All of it is starting material for a conversation with someone licensed to translate the framework into a plan for your specific circumstances.
Frequently Asked Questions
Diversification reduces the unsystematic, security-specific component of portfolio variance without proportionally reducing expected return. By combining assets whose returns are imperfectly correlated, the resulting portfolio has lower volatility than the weighted average of its components — a mathematically demonstrated outcome that has held since Markowitz formalized the result in 1952. It does not protect against systematic, market-wide drawdowns, when correlations across most asset classes converge.
Start with three inputs: time horizon, capital needs, and risk tolerance. Match those inputs to a target allocation across equities, fixed income, alternatives, and cash. Within each sleeve, ensure no single sector or security dominates — owning seven mega-cap tech stocks is not equity diversification. Stress-test the portfolio mentally against a 30%+ drawdown and ask whether you would behave well during one. If the answer is no, the allocation is too aggressive regardless of what your risk tolerance questionnaire says.
Equities provide long-run growth and inflation protection at the cost of higher short-run volatility. Fixed income provides income and historically dampened equity drawdowns, though that relationship weakened in 2022. Real estate (via REIT ETFs) provides inflation-correlated income and diversification away from corporate equity factors. Alternatives — private credit, commodities, gold — are designed to be uncorrelated with the equity-bond complex. Cash provides optionality and dry powder, not yield.
A common starting point is the Rule of 110 — subtract your age from 110 to get a target equity weighting. A 30-year-old targets ~80% equities; a 60-year-old targets ~50%. Within those bands, a 10–15% allocation to alternatives is now considered standard, with the remainder split between fixed income and cash. The Rule is a default, not a prescription; individual circumstances belong to a licensed financial advisor.
A passive allocation using one US total-market stock fund (VTI / FZROX / SWTSX), one international stock fund (VXUS / FZILX / SWISX), and one US total-bond fund (BND / FXNAX / SWAGX). The 60/20/20 version of this portfolio has produced 11.19% annualized over the trailing 10 years through April 2026. Its merit is implementability and decision-resistance, not return outperformance.
Use the 5/25 rule: rebalance when any asset class drifts more than 5 percentage points absolute from its target, or more than 25% relative to its target weight, whichever triggers first. Check semi-annually or annually. Quarterly checking adds turnover and tax friction without meaningful return improvement in most regimes. Always rebalance using cash flows and tax-advantaged accounts first before realizing gains in taxable accounts.
Yes, as a core framework. The 60/40 returned −17.5% in 2022, but it returned +17.2% in 2023, ~15% in 2024, and ~15% in 2025. Many institutional allocators (Apollo, Goldman Sachs) now prefer a 40/30/30 model — 40% equities, 30% fixed income, 30% alternatives — as a more robust modern framing, but the 60/40 remains a defensible default for investors who do not want or cannot access an alternatives sleeve.
For most retail investors, 5–15% across REIT ETFs, commodity / gold ETFs, and (optionally) public BDCs or interval credit funds. High-net-worth investors at $25M+ average ~34% in alternatives, but that level depends on illiquidity tolerance and capital scale that retail investors usually cannot match. Cryptocurrency, if held at all, is typically capped at 1–5% of total portfolio.
Check Out These Related Articles

Securing Financial Health: Safeguarding Consumer Interests in Investment Products

Finance Mentor vs Sponsor: What Actually Compounds a Career

Youth-Led Financial Revolutions: Crowdsourcing as a Catalyst for Investment Innovation